Took this one this morning:
This was my thought process:
Probability Checkboxes:
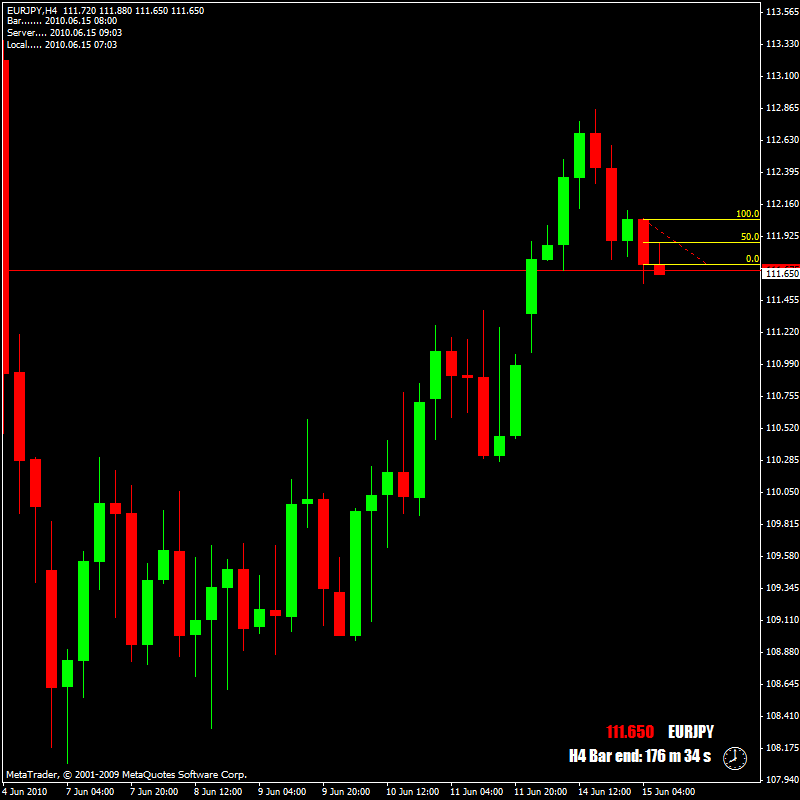
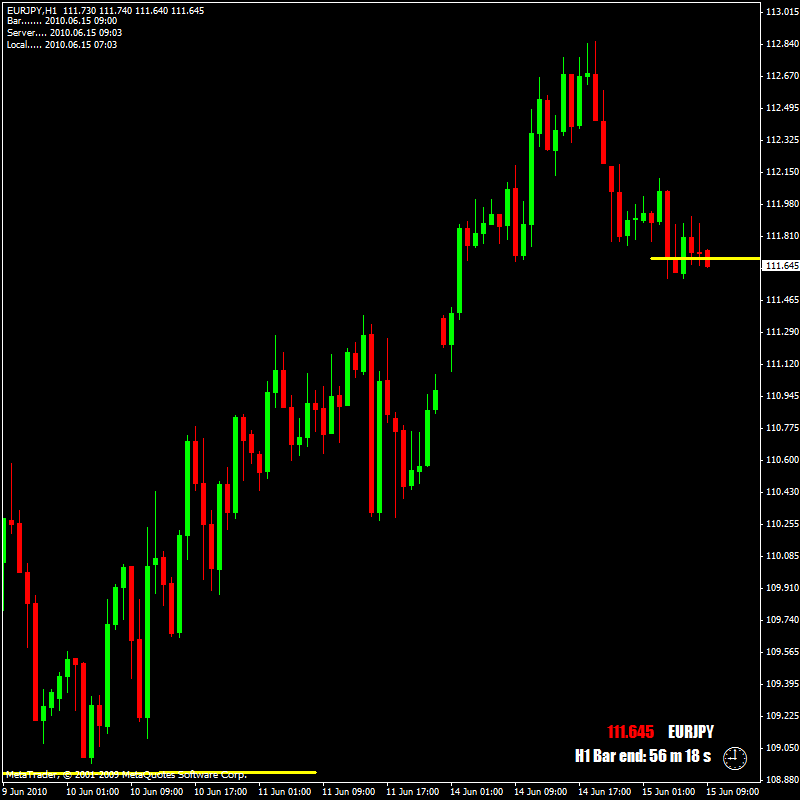
a) Price in H4 and H1 zones (defined by MOMO candles)
b) Sema confirmation in H4 / H1 zone on M15 chart
c) Close of first other colour M15 candle
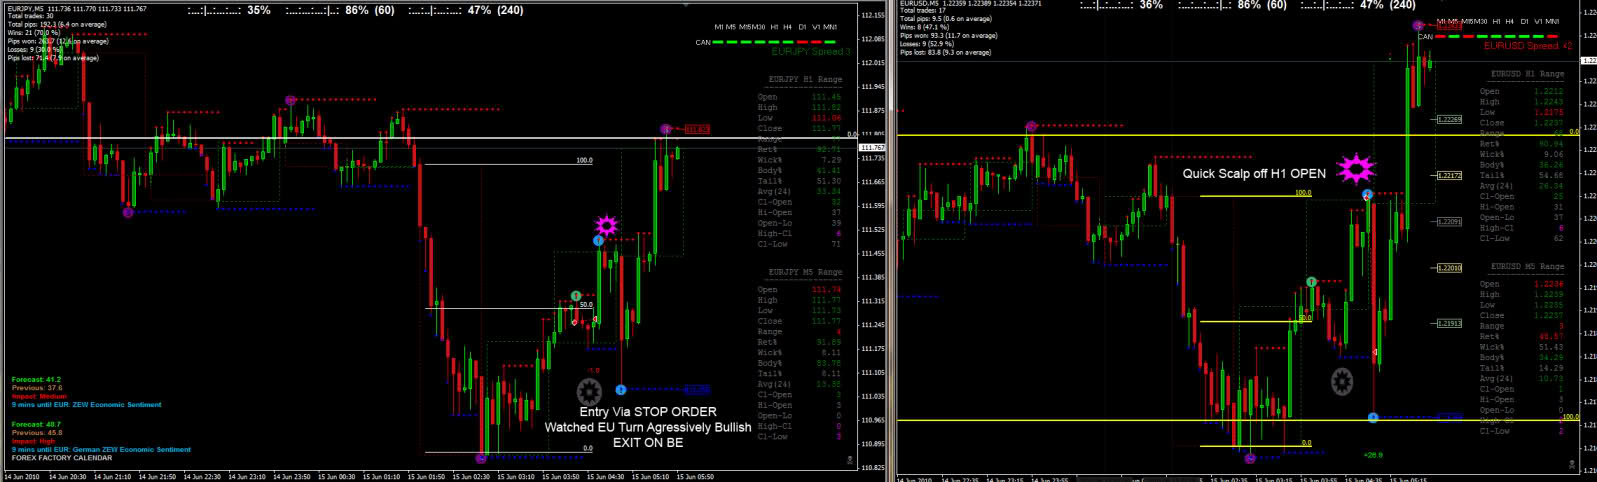
All these were checked but noticed the huge SHORT MOMO in the overlay (circled in yellow) so I thought based on yesterday that I am waiting for the next H1 candle to close before making a decision.
The next BLUE H1 closed below the 50% level of the RED MOMO H1 candle so failed to close higher therefor I thought a SHORT would have been safe.(I think this part of my analysis as just crap!)
However I did take 9 pips ...entered short at 50% level of RED H1 MOMO candle @ 1.21949.

In retorspect I am thinking the following... while I did everything right at this point - the fault in my analysis was two fold:
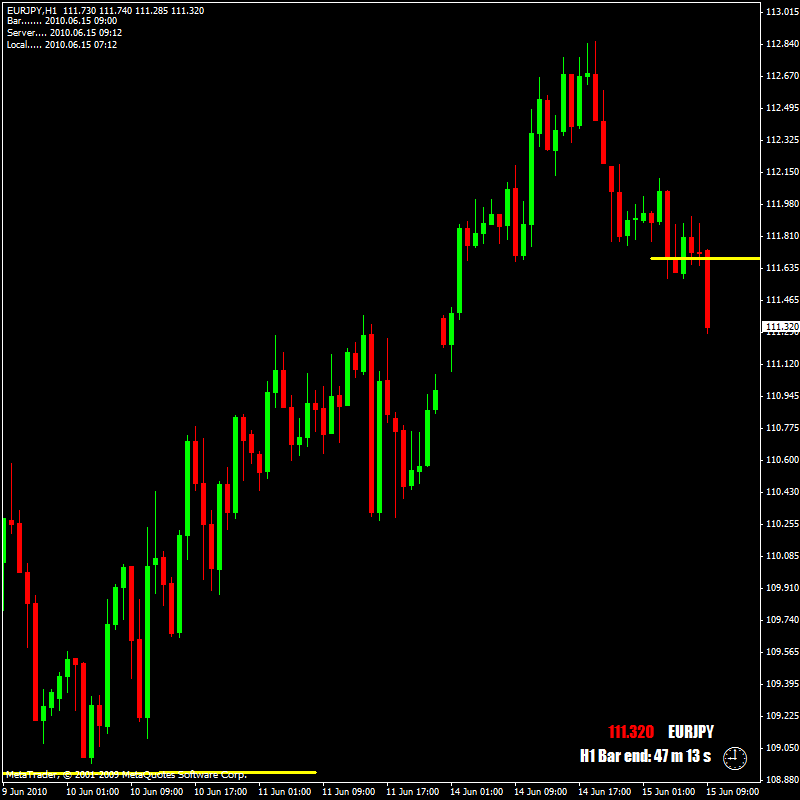
1) Price failed to close lower ( below RED H1 MOMO candle) as MOMO was down - that would indicate that price may start reversing now. However the opposite would be true if MOMO was upwards and price failed to close higher, than a reversal may be possible.
2) A double bottom formed. I am a little unsure as to its significance and when tp pay attention to them and what they may imply. But looking at some charts it seems that they are a good indication of reversal coming our way.
Are these retrospective analysis on the right track?