Pro Trader wrote:Hi all. I've been following this thread for a little while now and I whilst demo trading I've had the most consistent wins using these concepts than with anything else I've traded. I'm actually reading the chart now as appose to relying on indicators to trade. It is indeed much better.
Took my first live trade today which ended in profit which was good but I didn't hold till my target. That will come with time I'm sure.
Just wanted to thank all for their posts and comments. It is all really helpful. Any advice or comments are welcome
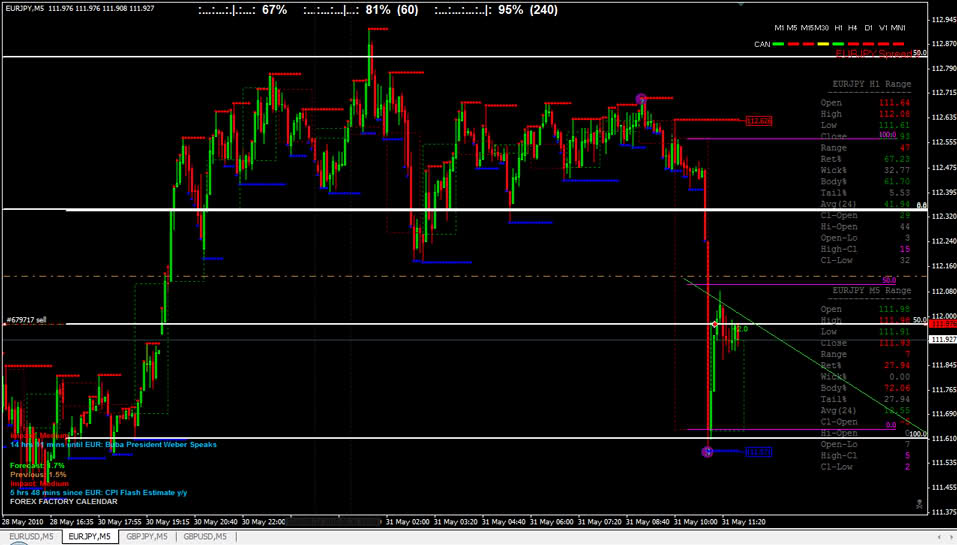
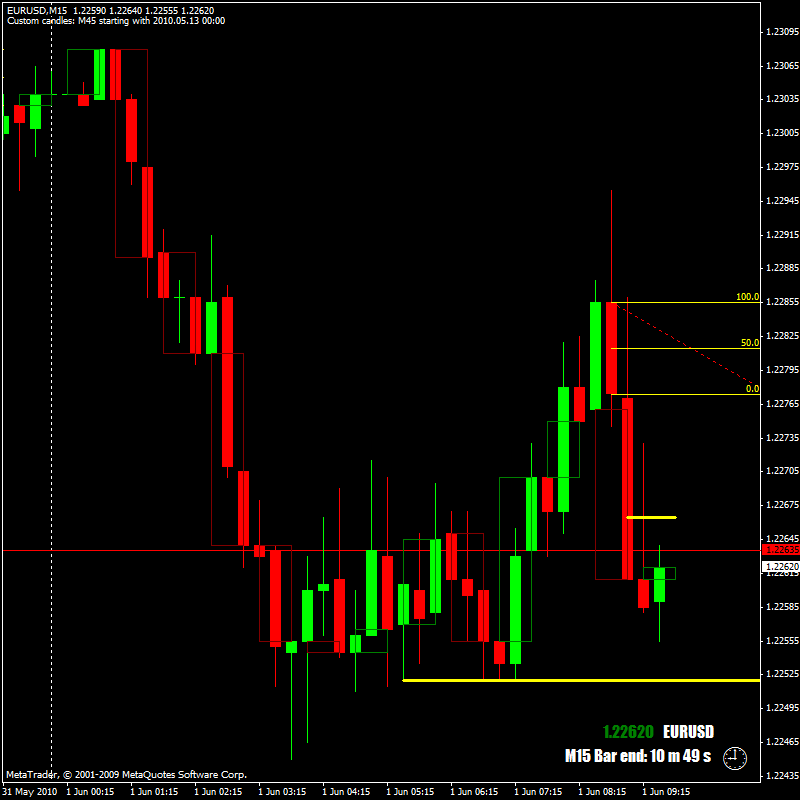
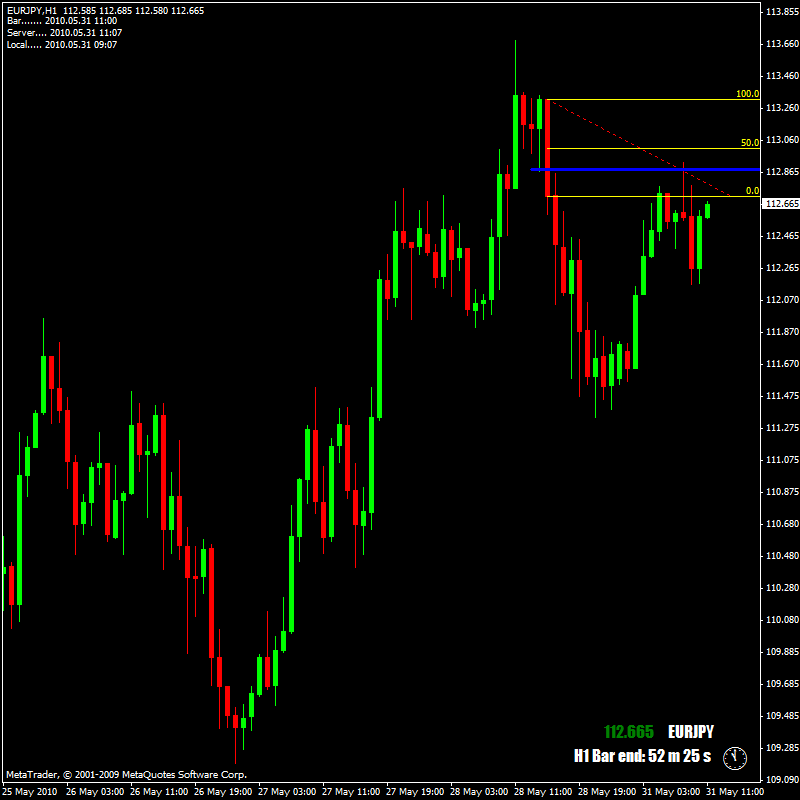
EJ H1: Price was heading up to the 50% level of the red momo, hit a zline indicated by blue line then started to reverse and continue back down.
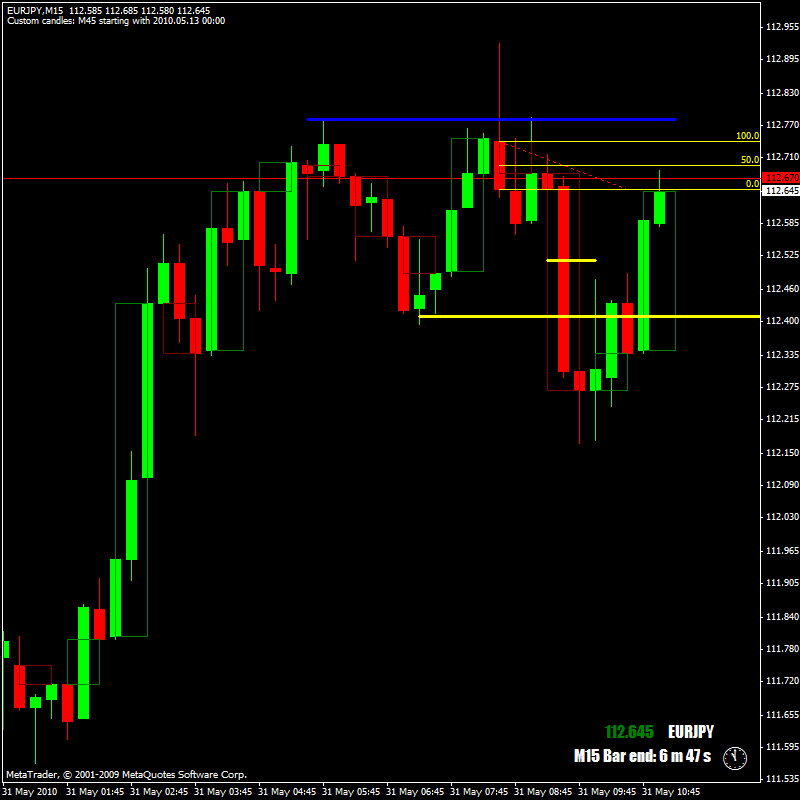
I then dropped to the 15m to look for an entry.
Marked up 50% area on reversal candle from H1 analysis then waited.
Next candle hit the 100% level before reversing.
I entered at the 0% price with a 20 pip SL which was above the zline marked in blue (I didnt have all these extra lines to trade I just added them for this post to show my process)
Target was solid yellow line but I came out at the short yellow line in the middle of the red momo candle. I exited to early (obviously). Only afterwards did I remember MO's advice to exit after a Momo/long bodied candle. Only took 13 pip.
We live and we learn.
Hope to keep on learning as I trade.
Much pips to all
Yeah those trades are always the best ones to take, where it breaks a support/resistance level on high momo and then price wicks that area. I found you get the highest odds are getting those trades right.
That was a good trade you took, if you're looking for a target, you could of targetted the 50% area of that large bullish candle on the H1.
Keep in mind today was not a good day to trade. Most of the world took the day off and price hardly moved.
Good luck in your future trading.