lukx wrote:PTG I really appreciate your input in trying to open my eyes !
I got question, are there any simple rules that based on which I could easier recognize supply and demand zones, and be sure that I'm not mistaken?
I don't know , like, almost same size bars in close neighbor etc etc? Or it's rather hard to set any strict pattern for sup and demand?
Thanks, my pleasure. It helps me as well, because it forces me to put down in writing what I learned from watching those videos last weekend.
As for the zones: you can find the best explanation in Sam Seiden's videos. It's the basis of his trading and you absolutely need to understand this imho.
The dynamics between the amount of buyers and seller at any given time defines the price action. If the price is run up it is because of an imbalance: more buyers than sellers. At the turning point, aka pivot point, it changes to more sellers than buyers.
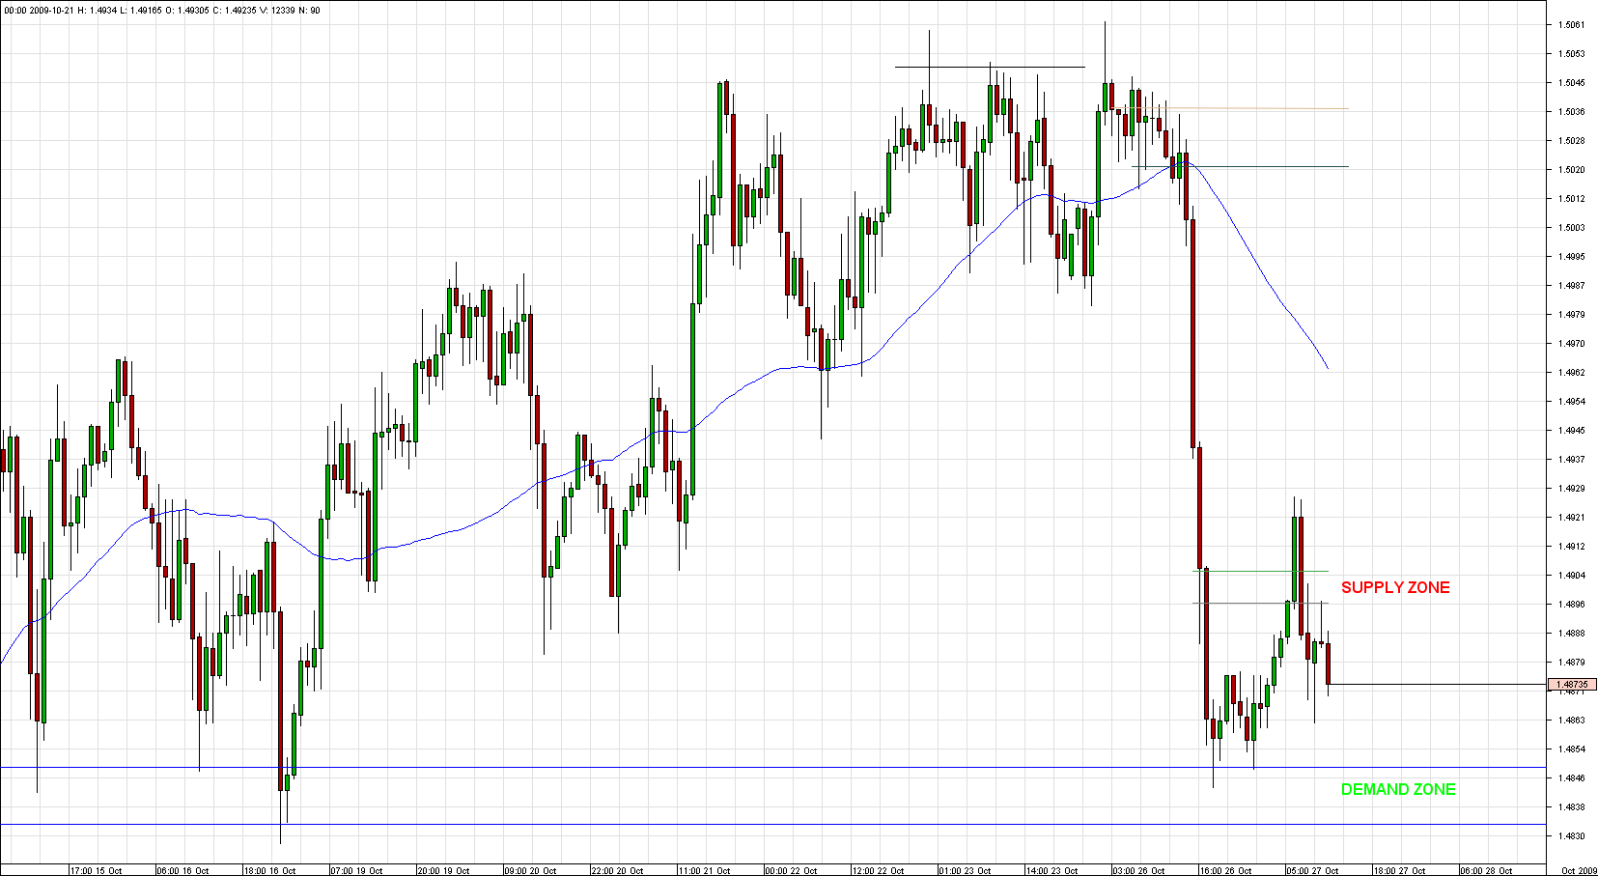
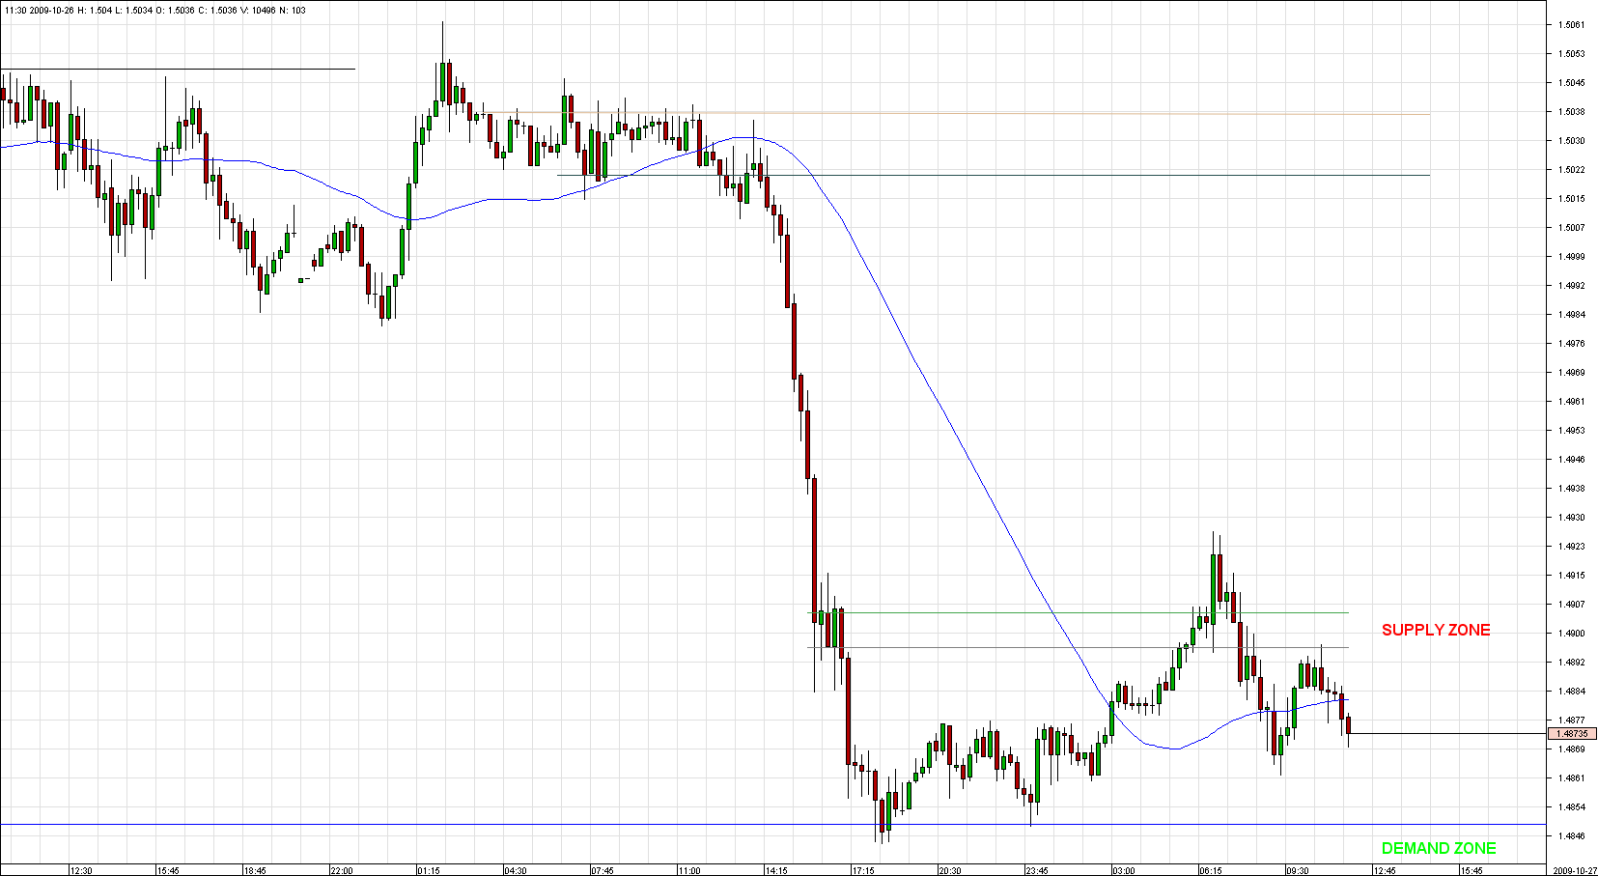
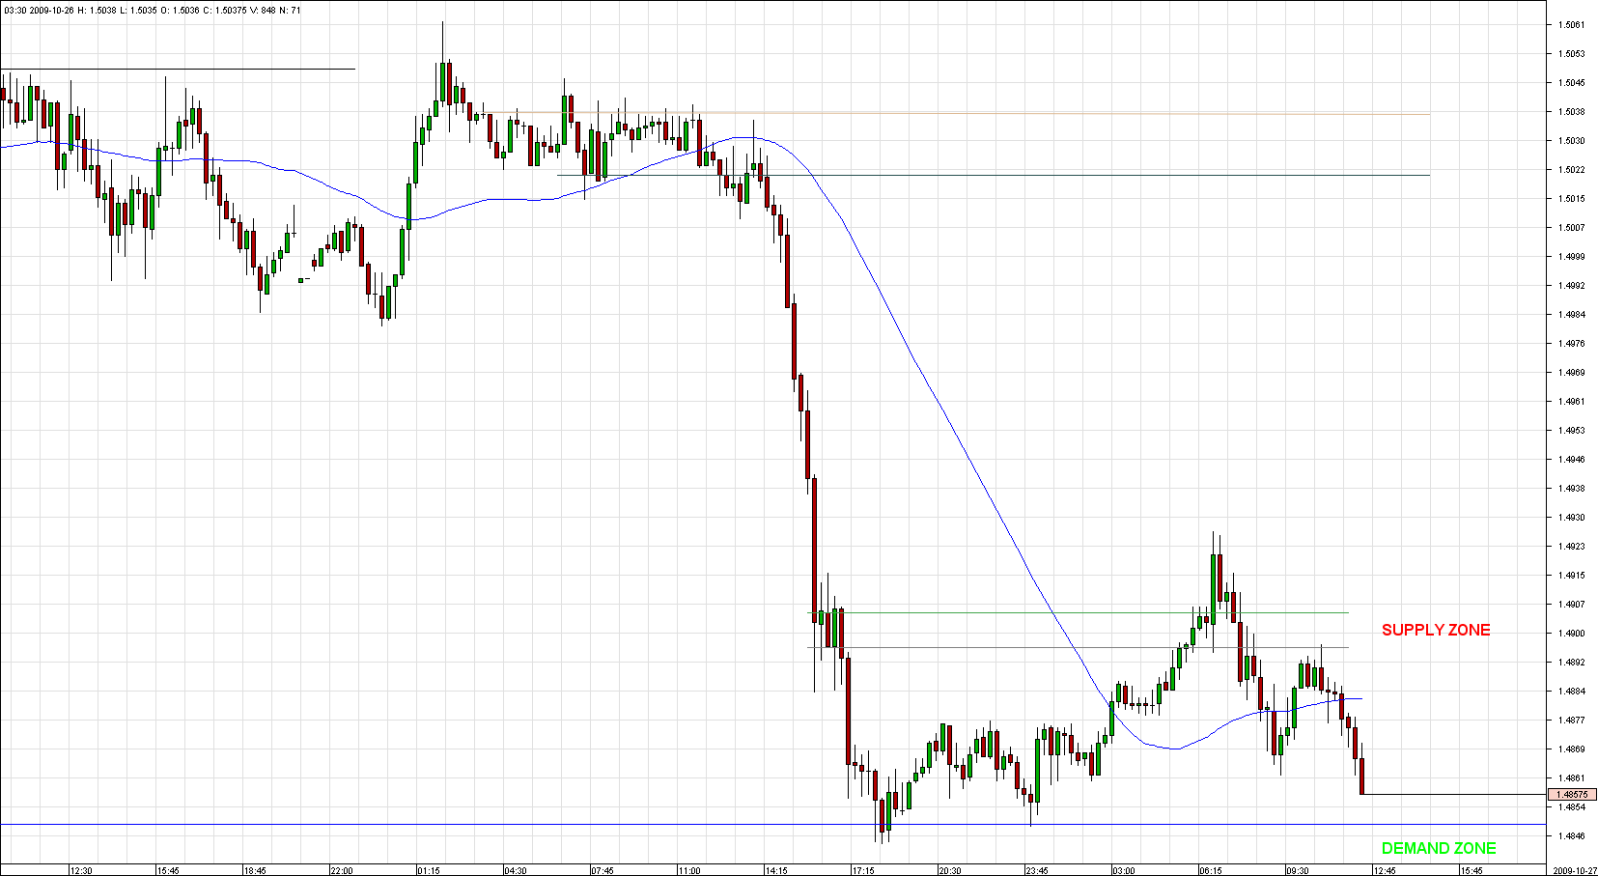
The basis for a run-up is from a congestion area. That is where the institutional orderflow is. For a demand area, when there are no more sellers, price runs up. Then, the retailers wake up with all their fancy squiggly's and want to get into the run-up, even when the price approaches the next supply zone, where a stack of institutional orders is waiting to be filled. Seiden explains this very well, you should go and watch those again, all of them. You will understand at some point.
For the demand/supply zones, you want to identify areas where multiple bars reside, or in other words where price stops. When you watch those video's, you should look exactly where he puts them. i think in a way it is a bit of an art, at which some are better than others. At the end of the day it doesn't really matter, as long as you stick to that 3:1 minimum profit margin (or more, whatever suits you).
You want to identify a group of bars that stays within a range.
There's no business like [strike]show[/strike] covid19 business.