dragon33 wrote:This is how i trade!
And your trades look so well organised!
Pleased to hear your knee is getting better.
Moderator: moderators
pablo101 wrote:adaseb wrote:spa wrote:adaseb wrote:es/pip wrote:adaseb wrote:
nice
Hey I just did what I noticed you were doing in previous trades.
I would label a few important points such as extremes, support, resistance lines and then look at the price action on the M1.
What you said before is true where either one or two things will happen.
1) it will either pass the area like it doesn't exist, or
2) it would reverse.
after marking the "interest" areas/lines and dialing down to 1m and 5m .. what are you looking at? a RAT type of entry with candle colour in the desired direction or smtg else?
Just look at the M1 and when price hits that certain area, look what is happening.
If its forms a candlestick that looks like a reversal, if it has momo in the opposite direction, etc.
And ignore the area if price just zooms right by it.
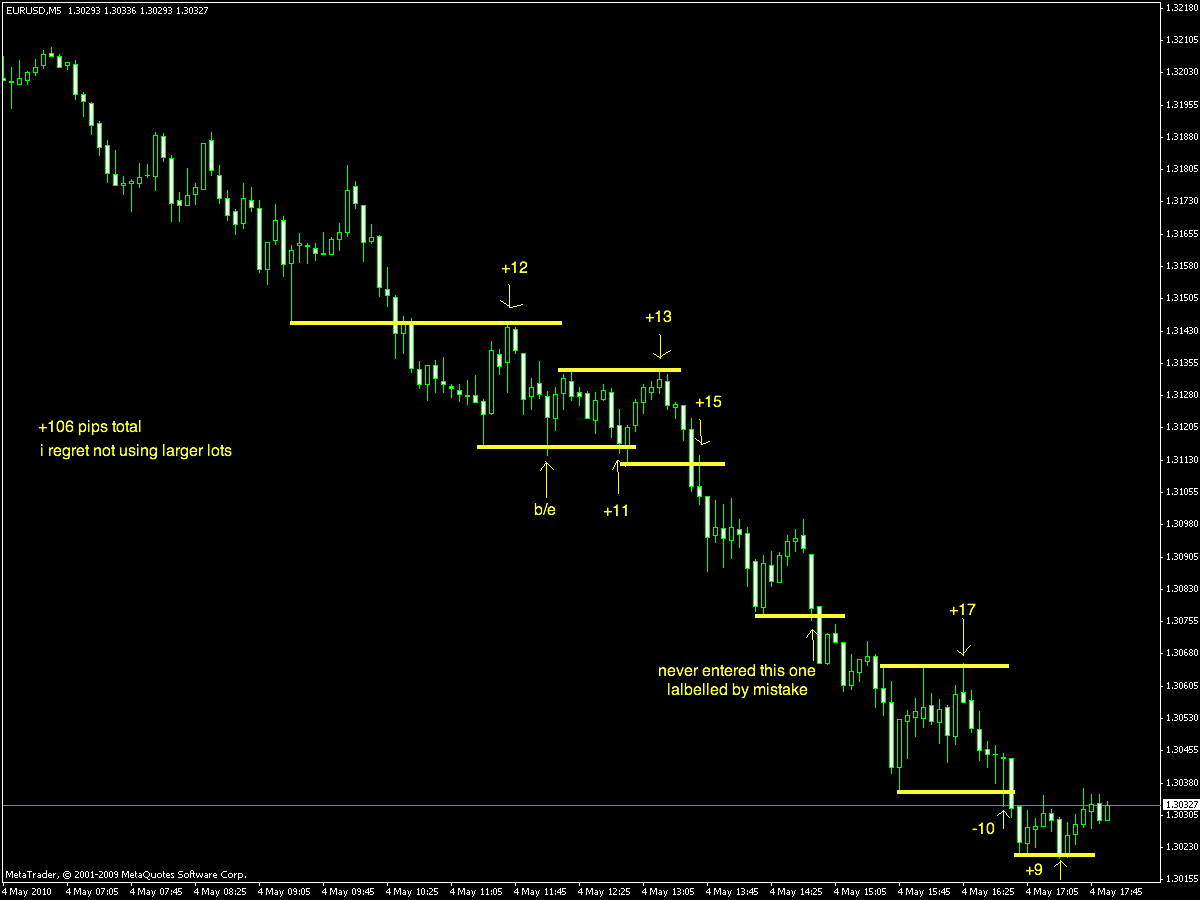
For example, in the trade that I labelled by accident. Looking at the M1, there was no reason to go long there.
Yes, most times I look at M1 for entries trading off major pivot levels, 'sometimes' all it takes is a sema to make a decision.
Who are you getting you charts from adaseb please?
newark18 wrote:Seriously, I now see the markets as a battle between pros and the herd. But since no one responded to my other post, I think I need to rethink that theory.