lukx zline trading log + cfabian p.35 + adaseb p.48
Moderator: moderators
-
IN-XS

- rank: 150+ posts

- Posts: 304
- Joined: Tue Jan 27, 2009 12:00 am
- Reputation: 0
- Location: UK
- Gender:

I have to say es/pip I am loving the clarity of your charts, no indicators, no mess. I having been trying a similar sort of method to you and have been having pretty good results. I find I can hold my trades longer because I am entering close to the turning point, before I entered on the rat method, which happens after the move and I find increases drawdown and therefore risk.
Please add www.kreslik.com to your ad blocker white list.
Thank you for your support.
Thank you for your support.


es/pip wrote:swing account
this is a follow up on the previous W1 chart i posted on the euro
in and out a couple times so far but now i am in at a pretty good spot and will hold to see what happens
i will be watching to see what happens in the 1.3787 ish area
if we can get above that and hold then i will be looking for 1.4216 ish area
Few people impress me
You are one of them

MightyOne wrote:es/pip wrote:swing account
this is a follow up on the previous W1 chart i posted on the euro
in and out a couple times so far but now i am in at a pretty good spot and will hold to see what happens
i will be watching to see what happens in the 1.3787 ish area
if we can get above that and hold then i will be looking for 1.4216 ish area
Few people impress me
You are one of them
thanks
Bend over and assume the position for another 4 years of hope and change.
-
newark18

- rank: 500+ posts

- Posts: 562
- Joined: Thu Mar 11, 2010 3:32 am
- Reputation: 21
- Real name: J
- Gender:

A picture says a thousand words. My guess is that once you find the right "slope" (which is the equilibrium?) then you can watch the price action around this area to "predict" price movement. Am I close?
Sometimes I feel like a character in Lost...whenever I find an answer, a whole plethora of questions come up.
Sometimes I feel like a character in Lost...whenever I find an answer, a whole plethora of questions come up.
MightyOne wrote:newark18 wrote:MO,
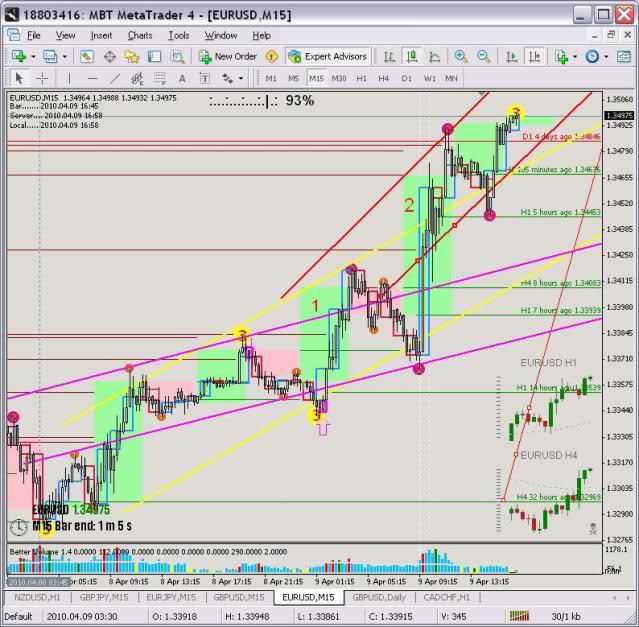
Here is my stab at diamond of perception. I haven't fully grasped the concept so this may be extremely wrong but here goes:
The pink channel is the 15* channel. One the candle breaks north of this channel (marked 1), the price trends on the 30* channel in yellow.
Then the candle breaks north again (marked 2), the price trends on the 45* angle in red channel.
Am I way off?
Failure is an opportunity to learn.
-
newark18
- rank: 500+ posts
- Posts: 562
- Joined: Thu Mar 11, 2010 3:32 am
- Reputation: 21
- Real name: J
- Gender:
Can you help me locate that post?
aliassmith wrote:franck wrote:Let me input certain reverse engineer on DOP, although my input may not be the intended message in the 1st place. it's magical anyway
1) What is/are the purpose/s of DOP? The answer arose from the need i see. It is one of the many tools around.
a) To identify a wick entry.
b) To find a point of a time-frame bar when one should look to change color ie red or green rat. Every bar must have a point.
c) To exit at a wick extreme before the wick of the next bar, if i know/FEEL the correction maybe large.
2) How do i use it? Wait for the price to go there and watch. Sometimes, it is good just to take the risk at that point. There is no need to think/analyse when the risk can be lessened to only 5-10 pips depending on the pair.
it puzzles me when one is willing to pay 30-60 pips but not 5-10 pips to find out if they are right or not. 6 x 5 pips = 30 pips shows me i have got 6 times to get it correct! They must be thinking that 30-60 pips makes one MORE correct than using a 5-10 pips stop.
Between this post and the one you did in MO's MBT thread it appears to
cover Price Action in it's lovely glory. Trading is fairly simple once you see
what to look for. The hardest part is to get the mind and fingers to work
together.
Failure is an opportunity to learn.
Please add www.kreslik.com to your ad blocker white list.
Thank you for your support.
Thank you for your support.
newark18 wrote:Can you help me locate that post?aliassmith wrote:franck wrote:Let me input certain reverse engineer on DOP, although my input may not be the intended message in the 1st place. it's magical anyway
1) What is/are the purpose/s of DOP? The answer arose from the need i see. It is one of the many tools around.
a) To identify a wick entry.
b) To find a point of a time-frame bar when one should look to change color ie red or green rat. Every bar must have a point.
c) To exit at a wick extreme before the wick of the next bar, if i know/FEEL the correction maybe large.
2) How do i use it? Wait for the price to go there and watch. Sometimes, it is good just to take the risk at that point. There is no need to think/analyse when the risk can be lessened to only 5-10 pips depending on the pair.
it puzzles me when one is willing to pay 30-60 pips but not 5-10 pips to find out if they are right or not. 6 x 5 pips = 30 pips shows me i have got 6 times to get it correct! They must be thinking that 30-60 pips makes one MORE correct than using a 5-10 pips stop.
Between this post and the one you did in MO's MBT thread it appears to
cover Price Action in it's lovely glory. Trading is fairly simple once you see
what to look for. The hardest part is to get the mind and fingers to work
together.
http://kreslik.com/forums/viewtopic.php ... &start=460
-
bredin

- rank: 1000+ posts

- Posts: 1033
- Joined: Mon Feb 16, 2009 10:41 pm
- Reputation: 7
- Gender:
- Contact:
forexjake80 wrote:you lost me there bredin...? So how do i get that sucker to paint?
It needs to be loaded as an EA, not an indi (ie from the /experts folder instead of the /experts/indicators folder).
I think the rectangle also needs to be named something specific as well, but dont quote me on that....
Its been a while since I looked at it.
G.
Welcome to the era of "Guns and Maskies" Trading!
The previous message contains discretion. Viewer nudity is advised.
Insanity Industries Indicators Here
Insanity Industries on YouTube!
The previous message contains discretion. Viewer nudity is advised.
Insanity Industries Indicators Here
Insanity Industries on YouTube!
-
newark18
- rank: 500+ posts
- Posts: 562
- Joined: Thu Mar 11, 2010 3:32 am
- Reputation: 21
- Real name: J
- Gender:
Well, this chart shows that price is channeling between a 35% angle almost perfectly. Do I need to find the pivot line within this channel too? Or can I merely use the information seen when extreme candles break the channel? I am still not exactly sure what the DOP is but it seems like the channel can shows changes in trend and the pivot point can help determine direction of the trade.
I am starting to understand the importance of spatial intelligence. Most of us are so concerned about rigidty and rules of trading when others might be using solely their spatial intelligence to see changes in the market.
I am starting to understand the importance of spatial intelligence. Most of us are so concerned about rigidty and rules of trading when others might be using solely their spatial intelligence to see changes in the market.
Failure is an opportunity to learn.
-
newark18
- rank: 500+ posts
- Posts: 562
- Joined: Thu Mar 11, 2010 3:32 am
- Reputation: 21
- Real name: J
- Gender:
Well, this chart shows that price is channeling between a 35% angle almost perfectly. Do I need to find the pivot line within this channel too? Or can I merely use the information seen when extreme candles break the channel? I am still not exactly sure what the DOP is but it seems like the channel can shows changes in trend and the pivot point can help determine direction of the trade.
I am starting to understand the importance of spatial intelligence. Most of us are so concerned about rigidty and rules of trading when others might be using solely their spatial intelligence to see changes in the market.

I am starting to understand the importance of spatial intelligence. Most of us are so concerned about rigidty and rules of trading when others might be using solely their spatial intelligence to see changes in the market.
Failure is an opportunity to learn.
Please add www.kreslik.com to your ad blocker white list.
Thank you for your support.
Thank you for your support.