adaseb wrote:How is everyone's trading going?
Anyone find this week a little more tougher to trade?
My week was great, except for a $%&@# 20 pips stop.
Moderator: moderators


MightyOne wrote:newark18 wrote:If you are referring to your diamonds of perception, then I am not quite there yet.
You do not need to be.
The purpose of the Diamond of Perception is to reduce 90 possible angles down to 15:
15-20-25-30-35-40-45-50-55-60-65-70-75-80-85
and then start by focusing on main angles within the group:
15-30-45-60-75
30-45-60
45.
A magical thing starts to happen when you use the Diamond of Perception
YOU FEEL PRICE.
prochargedmopar wrote:bacoazul wrote:prochargedmopar wrote:The bad thing about custom candle is that I can use it to re-affirm a faulty bias.
Do you want to go long?
Or do you want to go short?
I see you tossed in the 30/30. Maybe a filter for shorts eh? LOL
Where have the banks drawn their line?
check, check, check, BOOM
All this are MO's posts
MightyOne wrote:
Ok, now how many of you are aware that you should rarely combine more than 3 candles? A candle will fill its range within the first or second half or in a 3rd of its duration. When you combine too many periods you have too many moving parts and this dilutes the power of the extremes.
1) In Basic terms, the point of combining candles (into 3), is it to keep track of the long term trend so not to liquidate a good position too soon?
I combine candles into 2 or 3 and rarely 4.
2) Or is it also to help us see what price really is doing (e.g. closing/ failing to close beyond exremes) ?
It is for a lot of reasons, what you said being one of them.
Exactly my point.
We are told to trade multiple time frames................there are a hell of a lot of H1 candles in a yearly charts "3" candles.
At times it seems targets and direction get very confusing/skewed when not focusing in on a narrow range of time frames, at least for me up to this point in my career.
adaseb wrote:How is everyone's trading going?
Anyone find this week a little more tougher to trade?


MightyOne wrote:Your two-dimensional minds amuse me...
Look at the bodies and the underlying price action on my charts
How are my charts different from your own?
And NO PRO the 30/30 is not a "filter" so much as it is what MZ is based upon; equilibrium lines.
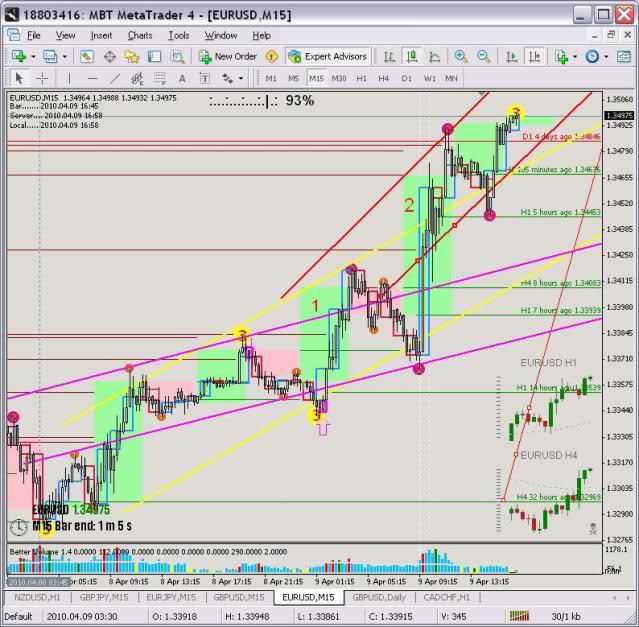


I may also be very wrong, but it looks to me like a 30 channel (basically from the inital hi2/low3, through the hi3/lo3 and the next hi2/lo2) accelerating into a 60 channel (basically a line betwiin the last two 3 sema)newark18 wrote:MO,
Here is my stab at diamond of perception. I haven't fully grasped the concept so this may be extremely wrong but here goes:
The pink channel is the 15* channel. One the candle breaks north of this channel (marked 1), the price trends on the 30* channel in yellow.
Then the candle breaks north again (marked 2), the price trends on the 45* angle in red channel.
Am I way off?