

Well it seems that you are finally getting it.
You can read all that you want, but it takes experience to actually learn it.
Libertarians take on trading
Moderator: moderators
Please add www.kreslik.com to your ad blocker white list.
Thank you for your support.
Thank you for your support.
Re: EURCAD
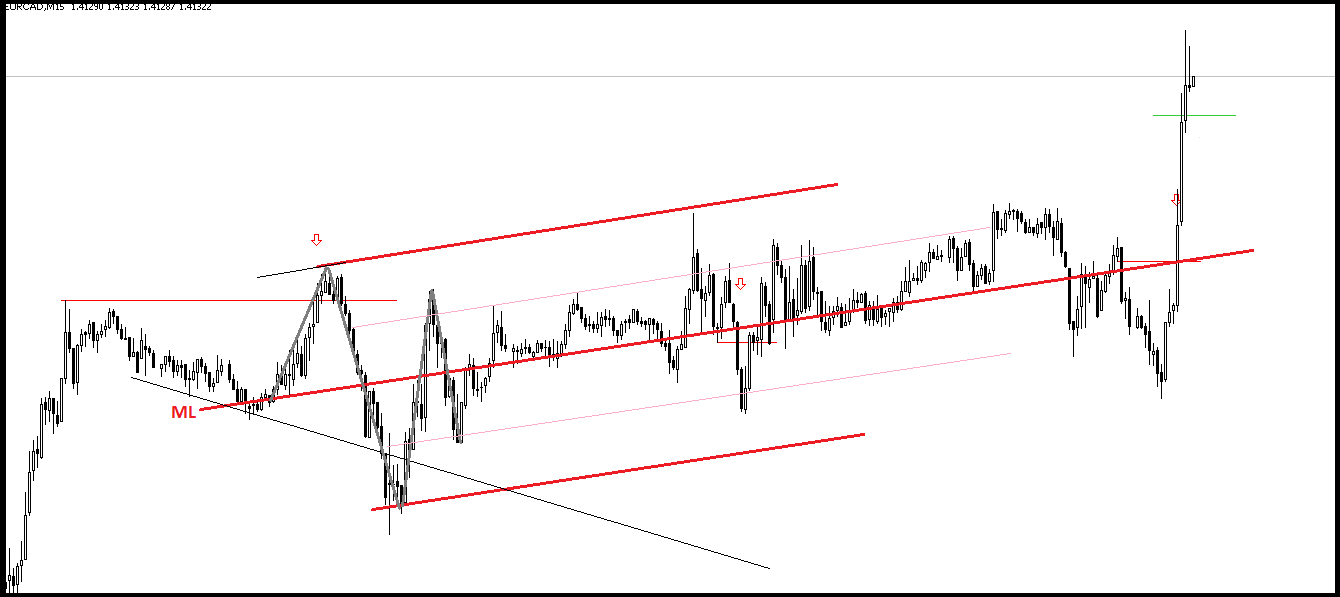
Libertarian wrote:Here is how the EURCAD trade ended up. As you can see from the picture, I expected "something" to be at the breakout of that long time Support level. As marked on the previous chart. So I tried 3 times to get short there. All the time trying to get short from the extreme. I used the 15 min chart for my picture and took the CC off so it would be more clear. I used more than the 15 min chart and the CC in my decision process. All the arrows are where I entered and the lines give you some reasoning behind the entry beyond trying to be short from the extreme. The last two HH are where I exited and the green line is where I exited the final position. The good news is that I still have 60% left of the risk ledger.
Happy Thanksgiving!
Just got around to looking at this chart
Found it interesting though...
-
Libertarian

- rank: 150+ posts

- Posts: 267
- Joined: Tue Nov 30, 2010 6:32 am
- Reputation: 178
- Location: MN
- Gender:

Re: Libertarians take on trading
This is a frustrating one. This was just going to be a quick little scalp back down to the low to fuel my "real trade" higher and I was going to get rich... ](https://www.kreslik.com/forums/images/smilies/eusa_wall.gif "Brick wall")

Entry at line, exit waaaay up there.
Entry at line, exit waaaay up there.
- usdjpy-h1-mb-trading-futures.png (10.44 KiB) Viewed 3870 times
-
Libertarian
- rank: 150+ posts
- Posts: 267
- Joined: Tue Nov 30, 2010 6:32 am
- Reputation: 178
- Location: MN
- Gender:
Re: Libertarians take on trading
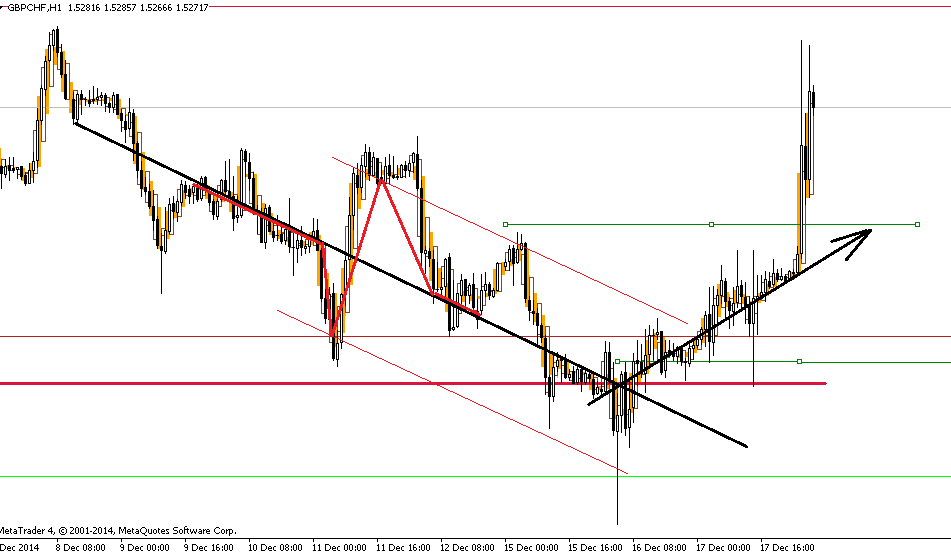
Lots of issues on this one. Entry and exit at the green lines.
The one thing I can say is that even with this track record I still have 48% of my space left. Protect your capital.
The one thing I can say is that even with this track record I still have 48% of my space left. Protect your capital.
- gbpchf-h1-mb-trading-futures.png (14.79 KiB) Viewed 3870 times
Re: Libertarians take on trading
Lots of issues on this one. Entry and exit at the green lines.
I'm baffled by your choice of colors
I assume, by reading the rest of the post, that you went short but I don't see how nor do I understand
how you would hold when it turned into a giant wick.
Please add www.kreslik.com to your ad blocker white list.
Thank you for your support.
Thank you for your support.
-
Libertarian
- rank: 150+ posts
- Posts: 267
- Joined: Tue Nov 30, 2010 6:32 am
- Reputation: 178
- Location: MN
- Gender:
Re: Libertarians take on trading
We'll that awful s**t brown color you had before certainly doesn't work, must be osmosis 
I realize that the picture I posted was poor, but I just kind of threw it up there. Here was my thought process.
So I missed the sell limit (first arrow) by 1.2 pips. I saw it shoot down and make a giant wick at a major BO (thicker RED line). I thought nice they are coming back to me to freakout/zero all those BO's of a major daily pivot. I'll just jump in here because price is still lower than something. Well price kept slowly but surely marched higher and eventually closed higher. I was watching what I thought was S/R line just higher (ugly green line drawn from a floating high from 1/22/14) which I really thought I was right when I got a nice Body close lower. But price kept climbing and by this point I said *censored - swear word* it, it will just zero out all the traders from the last correction. And it got very wicky in there. I saw it plant that wick in my direction (*censored - swear word* Fed announcement the thing was going bonkers) I assumed it was clearing the Small traders in my way as it will often bounce down and bounce back up and continue to find resistance (its got to eat all the stops right?), it was still under my ZL and lord knows its no picnic catching one of those sometimes so I thought I was good. I finally set my SL (bed) at the green line a bit above the high hoping for worst case a run of the stops sitting behind there and continuation of my way. To recap what happen in reality...NONE of that. Should have a very small loss vs. taking a small loss (lot size). I swear to god I'm a legend in my own head.
- gbpchf-h4-mb-trading-futures.png (17.17 KiB) Viewed 3870 times
- gbpchf-h1-mb-trading-futures-2.png (18.67 KiB) Viewed 3870 times
Re: Libertarians take on trading
Support & resistance is neither above nor below but always something that was overcome-MO
-
Libertarian
- rank: 150+ posts
- Posts: 267
- Joined: Tue Nov 30, 2010 6:32 am
- Reputation: 178
- Location: MN
- Gender:
Re: Libertarians take on trading
Momo up into a place I thought I'd find some resistance...4 hr/daily chart.
price closing lower (actually lower) than something on the small chart. Entry at red arrow. Exit at higher high.
- gbpchf-h4-mb-trading-futures-2.png (19.06 KiB) Viewed 3870 times
price closing lower (actually lower) than something on the small chart. Entry at red arrow. Exit at higher high.
- gbpchf-m15-mb-trading-futures.png (11.74 KiB) Viewed 3870 times
-
Libertarian
- rank: 150+ posts
- Posts: 267
- Joined: Tue Nov 30, 2010 6:32 am
- Reputation: 178
- Location: MN
- Gender:
Re: Libertarians take on trading
OK, new year new ideas new results (hopefully). Happy New Year to all and good luck in your trading.
I am going to make a better effort to update these charts in detail particularly. I have come back to the light and am trying to understand the lessons of a Mr. Pip. Hopefully I'm on to something.
First off the Daily, where it all begins...I was expecting a return to higher highs because of the freking rocket ship these Yen pairs have been on, but I saw the EJ heading lower and I noticed the UJ putting in a base and got a BDP off of it. The first thing that caught my eye was this zone because price had broken out here and blue line was the breakout of the daily candle. Caught my eye. Lets give this a short.
zoomed in and I saw priced closing lower than "something" around my blue line and in my larger zone.
Price was back into my risk box and I says to myself. Lets give this a go. I entered at the red arrow candle and the horiz red line was my price. I set my stop to the extreme I was trying to value and we'll it didn't work out. I lost a very small amount of space.
I am going to make a better effort to update these charts in detail particularly. I have come back to the light and am trying to understand the lessons of a Mr. Pip. Hopefully I'm on to something.
First off the Daily, where it all begins...I was expecting a return to higher highs because of the freking rocket ship these Yen pairs have been on, but I saw the EJ heading lower and I noticed the UJ putting in a base and got a BDP off of it. The first thing that caught my eye was this zone because price had broken out here and blue line was the breakout of the daily candle. Caught my eye. Lets give this a short.
- D1
- usdjpy-d1-mb-trading-futures.png (10.61 KiB) Viewed 3870 times
zoomed in and I saw priced closing lower than "something" around my blue line and in my larger zone.
- 4h
- usdjpy-h4-mb-trading-futures-3.png (13.06 KiB) Viewed 3870 times
Price was back into my risk box and I says to myself. Lets give this a go. I entered at the red arrow candle and the horiz red line was my price. I set my stop to the extreme I was trying to value and we'll it didn't work out. I lost a very small amount of space.
- 5m
- usdjpy-m5-mb-trading-futures.png (18.91 KiB) Viewed 3870 times
-
Libertarian
- rank: 150+ posts
- Posts: 267
- Joined: Tue Nov 30, 2010 6:32 am
- Reputation: 178
- Location: MN
- Gender:
Re: Libertarians take on trading
Here is one I am thinking about.
It just made a new BIIIIG time low, but I think its got to move a bit lower or more true, until the smaller charts convince me otherwise.
Daily TF, starts here. Does this mean anything to a DAY TRADER
Im short until it moves higher than this.
Since its not higher than that its lower than that. Zoom in for a closer look. Oh, this chart is also lower than something.
Finally where oh where to enter? I know an extreme I like but what if it never comes back? I believe that I can value a smaller one to get the space to move it to a higher one. But is that a good idea? I wonder. Hopefully I get a chance to not have to choose.
It just made a new BIIIIG time low, but I think its got to move a bit lower or more true, until the smaller charts convince me otherwise.
Daily TF, starts here. Does this mean anything to a DAY TRADER
Im short until it moves higher than this.
- d1
- eurgbp-d1-mb-trading-futures-2.png (11.08 KiB) Viewed 3874 times
Since its not higher than that its lower than that. Zoom in for a closer look. Oh, this chart is also lower than something.
- h1
- eurgbp-h1-mb-trading-futures-2.png (11.67 KiB) Viewed 3874 times
Finally where oh where to enter? I know an extreme I like but what if it never comes back? I believe that I can value a smaller one to get the space to move it to a higher one. But is that a good idea? I wonder. Hopefully I get a chance to not have to choose.
- m15
- eurgbp-m15-mb-trading-futures.png (20.79 KiB) Viewed 3874 times
Please add www.kreslik.com to your ad blocker white list.
Thank you for your support.
Thank you for your support.