Libertarians take on trading

free & uncensored discussion arena for TheRumpledOne

Moderator: moderators

User avatar
MightyOne
rank: 5000+ posts
rank: 5000+ posts
Posts: 6055
Joined: Wed Dec 10, 2008 6:33 pm
Reputation: 560
Gender: Male

"Something"

Postby MightyOne » Sun Jun 15, 2014 4:12 pm

Image


"Something" is both a line and an area.

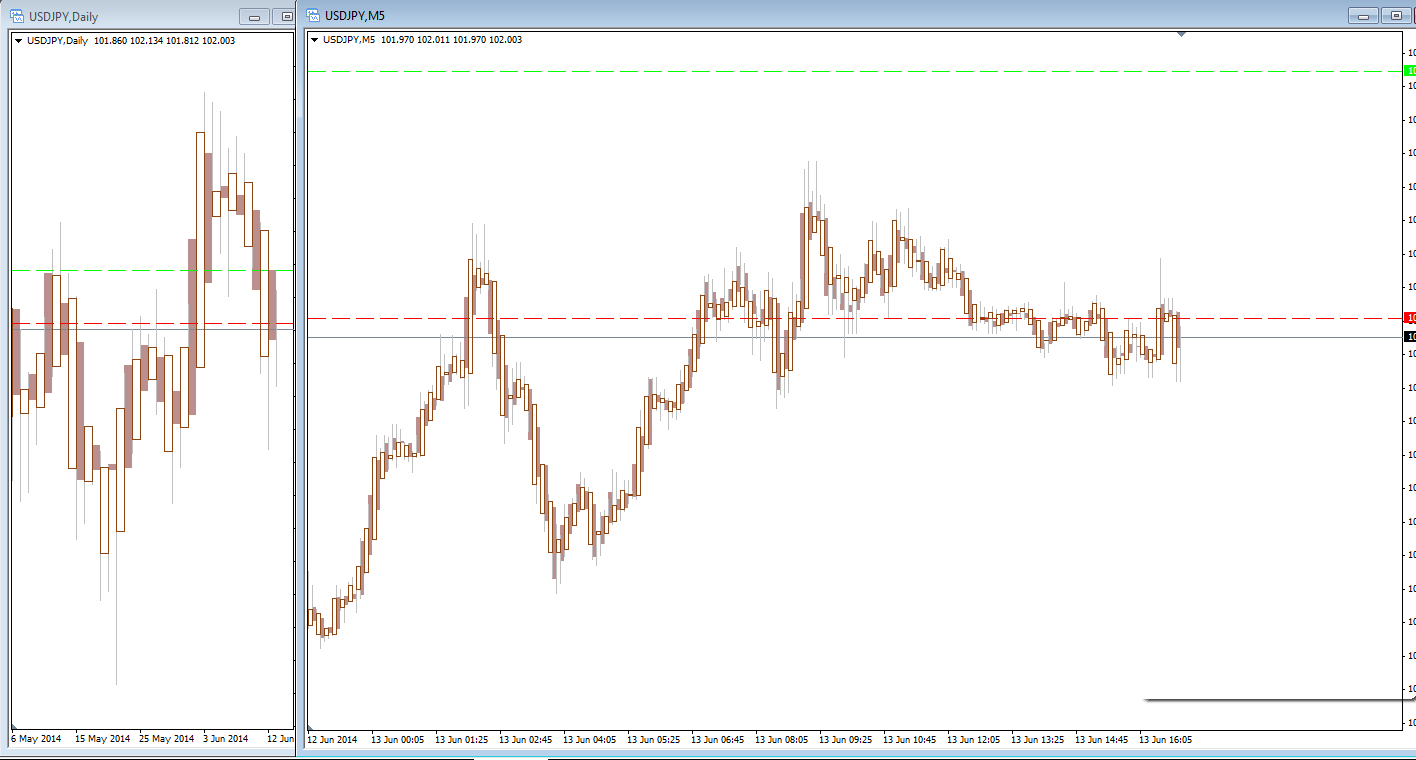
On short term charts we trade away from "something"
On long term charts we hold if price closes beyond "something"

:lol:

My "something" is the open of the current & next 2xCC.

Please add www.kreslik.com to your ad blocker white list.
Thank you for your support.

User avatar
xXx
rank: 50+ posts
rank: 50+ posts
Posts: 112
Joined: Sat Feb 12, 2011 10:30 am
Reputation: 1
Location: London
Gender: Male

Postby xXx » Sun Jun 15, 2014 5:07 pm

It took me a lot of time to accept the "something" concept :D

User avatar
MightyOne
rank: 5000+ posts
rank: 5000+ posts
Posts: 6055
Joined: Wed Dec 10, 2008 6:33 pm
Reputation: 560
Gender: Male

Postby MightyOne » Tue Jun 24, 2014 5:57 pm

I just want to say that you do not put the "Perfect Opens" indicator on the same chart as the 2xCC; silly rabbit. =)

User avatar
Libertarian
rank: 150+ posts
rank: 150+ posts
Posts: 267
Joined: Tue Nov 30, 2010 6:32 am
Reputation: 178
Location: MN
Gender: None specified

Postby Libertarian » Wed Jun 25, 2014 3:28 pm

MightyOne wrote:I just want to say that you do not put the "Perfect Opens" indicator on the same chart as the 2xCC; silly rabbit. =)
:lol: :roll:

User avatar
Libertarian
rank: 150+ posts
rank: 150+ posts
Posts: 267
Joined: Tue Nov 30, 2010 6:32 am
Reputation: 178
Location: MN
Gender: None specified

Postby Libertarian » Sat Jul 05, 2014 8:11 pm

xXx wrote:It took me a lot of time to accept the "something" concept :D


Care to expand upon that xXx?

Please add www.kreslik.com to your ad blocker white list.
Thank you for your support.

User avatar
Libertarian
rank: 150+ posts
rank: 150+ posts
Posts: 267
Joined: Tue Nov 30, 2010 6:32 am
Reputation: 178
Location: MN
Gender: None specified

Postby Libertarian » Sat Jul 05, 2014 8:29 pm

God damn it I hate this s**t. I was short the USDCHF. The Daily chart shows why I was thinking short and what I was looking at. Red line is the last stop for the BO traders that will zero them out. The green line is resistance become support become resistance and a BDP out of there. So I entered and price was cruising my way. On the hr chart I entered at the down arrow. I was scared at the X but survived. I saw big momo down into support and I sat and said I should hedge this sucker and get out, but I did nothing because I thought I'm aiming for a large chart and I don't want to miss it. Of course price comes back at W and closes over my momo candle so I hop out for a very small gain assuming it was going to make some kind of range and price proceeds to take off in my direction without me. That was my trade for the week.
Attachments
usdchfh1.png
usdchfh1.png (39.56 KiB) Viewed 4157 times
usdchfdaily.png
usdchfdaily.png (72.88 KiB) Viewed 4157 times

User avatar
xXx
rank: 50+ posts
rank: 50+ posts
Posts: 112
Joined: Sat Feb 12, 2011 10:30 am
Reputation: 1
Location: London
Gender: Male

Postby xXx » Sat Jul 05, 2014 8:47 pm

Libertarian wrote:
xXx wrote:It took me a lot of time to accept the "something" concept :D


Care to expand upon that xXx?

I was looking at MO's "Is it closing higher or lower than something"
I thought that the grey area it was something. It was not closing higher...
So I was selling. Then there was breakout and I was on the wrong side of the market (I know that there is no wrong side of the market - Position, Position, Position, Position... 8) )
The something was the red line and it closed higher, and higher and higher...
Attachments
2014-07-05 21_31_52-_ FxPro - MetaTrader 4 - [EURUSD,H1].jpg
2014-07-05 21_31_52-_ FxPro - MetaTrader 4 - [EURUSD,H1].jpg (63.24 KiB) Viewed 4236 times

User avatar
xXx
rank: 50+ posts
rank: 50+ posts
Posts: 112
Joined: Sat Feb 12, 2011 10:30 am
Reputation: 1
Location: London
Gender: Male

Postby xXx » Sat Jul 05, 2014 8:49 pm

It was closing higher than something
Attachments
2014-07-05 21_40_18-_ FxPro - MetaTrader 4 - [EURUSD,H1].jpg
2014-07-05 21_40_18-_ FxPro - MetaTrader 4 - [EURUSD,H1].jpg (83.09 KiB) Viewed 4145 times

User avatar
Libertarian
rank: 150+ posts
rank: 150+ posts
Posts: 267
Joined: Tue Nov 30, 2010 6:32 am
Reputation: 178
Location: MN
Gender: None specified

Postby Libertarian » Sat Jul 05, 2014 9:42 pm

So you mean a defined S/R? What I am struggling is the open piece that he refers to in the above. I think like a lot of things this is something that I have missed the boat on. Not paying attention to the key "moving" pieces. I have never paid attention to the open of candles. I always thought it was about the extreme. I fear I was very WRONG.
Attachments
eurusdh1.png
eurusdh1.png (68.38 KiB) Viewed 4137 times

User avatar
xXx
rank: 50+ posts
rank: 50+ posts
Posts: 112
Joined: Sat Feb 12, 2011 10:30 am
Reputation: 1
Location: London
Gender: Male

Postby xXx » Sat Jul 05, 2014 10:03 pm

MO says trade of Daily+ High/Low (now 2 days extreme I think).
Many guys here say that extremes are important as well.
I have got my trading system trading renko charts which I am testing and when I looked at my entries on renko charts and Dragon lines on candles I had an Eureka moments. Those lines are using the open/close and work very well and are real eye opener for me.
Attachments
2014-07-05 22_57_21-EUR_AUD,  Renko 20 Pips [7].jpg
2014-07-05 22_57_21-EUR_AUD, Renko 20 Pips [7].jpg (35.84 KiB) Viewed 4224 times

Please add www.kreslik.com to your ad blocker white list.
Thank you for your support.


Return to “TheRumpledOne”