thepark wrote:
hi MO
where would you short in H4/M30?
if you shorted around the diagonal line on M30, theres a huge change your short is too early since it hasn't confirmed down yet or gone all the way back up the H4 extreme.
and what are the strengths of this set up that make it tradeable?
what does the diagonal line represent?
is this tradeable if this was not an old D1 resistance? just from the H4 setup?
What is this 'confirmation' you speak of? Just risk lines and make lines.
I need to find a price level: close+close, close+wick, trace a breakout back to a pattern, ...something.
The fundamental idea is that you distinguish between patterns (one side of a line) and breakouts (the other side of a line).
Buy where you see buying (the pattern is behind the buying)
Sell where you see selling (the pattern is behind the selling)
Take profit roughly in the middle of patterns or where you see B/S
Harmony, trading multiple charts at the same time, is what makes it a good trade.
We might want to short a price, or within a zone, on a daily chart but we want to enter on the M30; how do we do that?
We simply narrow the range with H4 closes then M30 closes and finally M30 price action.
Even if there is no price level on the H4, we can still trade it because we are already within the price level of the D1: if there is no D1
price level then you need an H4 price level and if there is no H4 price level then wait for one.

- HIWHGG3.png (4.93 KiB) Viewed 3442 times
It is not enough to simply calculate the linewidth, you have to put the lines on the chart and observe how price is moving through the lines:
you might, based on volatility or necessity (you don't have very many lines in the bank), decide to trade H4 line widths or the daily widths if there is some reason to be bearish based on the daily+ chart.
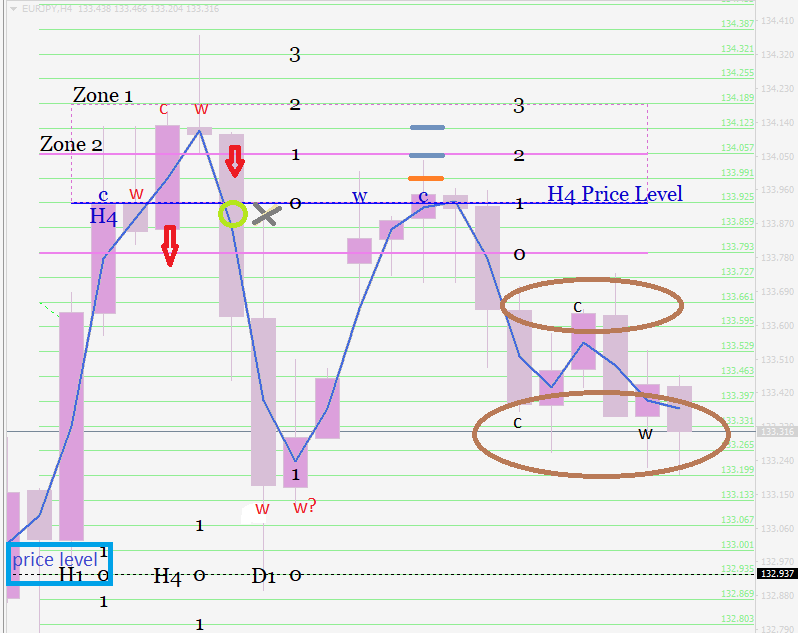
Below is how one might trade the same chart without looking at the daily:
See multiple options? That's because there are multiple options


- EURJPYH4.png (41.46 KiB) Viewed 3442 times
My whole thought process is centered around the idea of managing lines and increasing position sizes: if you try to follow along with what I am doing without that understanding then the chart might as well be in Gàidhlig. Consistently applying ideas is 'the trade', not the patterns and breakouts.
Risk lines, make lines, and deal with the results (adjust your position size, etc).

- EURJPYM30.png (47.03 KiB) Viewed 3442 times


 IS A LIE__________
 )
)