

Tyger, i change the color of my charts is for focus a more on the CC and less on the single tf candles
Blind Mouse Strategy
Moderator: moderators
Please add www.kreslik.com to your ad blocker white list.
Thank you for your support.
Thank you for your support.


vane so no more wild colored charts?
glad you are doing well.
glad you are doing well.
vane wrote:Erika this guys are crazy ... hahaha
Tyger, i change the color of my charts is for focus a more on the CC and less on the single tf candlesis darker now
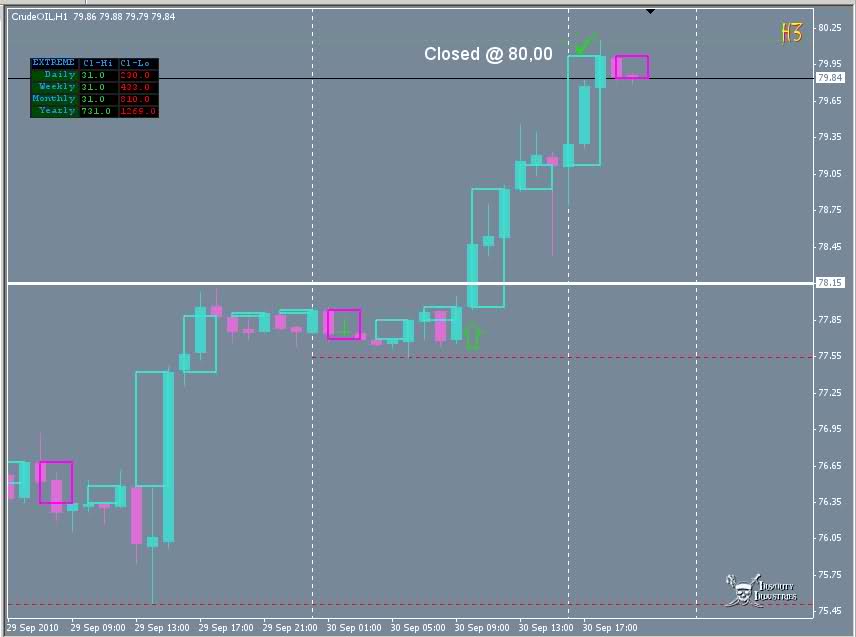
Price closed over a line that you believed to be support and that is the first indication that something is WRONG-MO
gfg1 wrote:vane so no more wild colored charts?
glad you are doing well.vane wrote:Erika this guys are crazy ... hahaha
Tyger, i change the color of my charts is for focus a more on the CC and less on the single tf candles
ahhh
P.S. Read the PM i hope it helps a little
-
newark18

- rank: 500+ posts

- Posts: 562
- Joined: Thu Mar 11, 2010 3:32 am
- Reputation: 21
- Real name: J
- Gender:

I never really understood the term, "Trade what you see." And I would always respond in my head, "Well, I gotta figure it out first." Trying to figure out the magic formula (i.e., zlines, momo, & BM) stopped me from seeing what was going on. I would always try to anticipate what was going to happen next using these rules. I was so focused on these rules that I did not understand what they meant. Zlines taught me that the market moves in waves, Momo taught me to see the power/strength of a move and BM taught me directionality. Knowing that, I can finally see what the market is doing. The candles are closing a certain direction. And knowing that it wants to move in waves, try to wait for some retracement first and get in. But don't get in until the market is telling you that it wants to stop retracing and keep going in your direction. You can be risky or wait for stronger confirmation. I guess it depends on your appetite for risk. But wait for some confirmtion (i.e., let the market show you where it wants to go first). You are not going to win all the time. But as long as you keep waiting for confirmation then you can ride some big waves and make some big pips.
Weekly direction is my guide. STF H8/CC D1 is my focus. STF H4 even seems too low with too much noise.
Stop trying to guess what the market is going to do next. Just let the market take you for a ride.
Weekly direction is my guide. STF H8/CC D1 is my focus. STF H4 even seems too low with too much noise.
Stop trying to guess what the market is going to do next. Just let the market take you for a ride.
Failure is an opportunity to learn.
Please add www.kreslik.com to your ad blocker white list.
Thank you for your support.
Thank you for your support.


-
TygerKrane

- rank: 1000+ posts

- Posts: 1733
- Joined: Mon Jan 25, 2010 3:36 pm
- Reputation: 297
- Location: Long Island, NY
- Gender:

vane wrote:Erika this guys are crazy ... hahaha
Tyger, i change the color of my charts is for focus a more on the CC and less on the single tf candles
Still Miss those charts though, but congratulations on the progress you are making, glad you're still doing it!!
**Krane catches Tyger** !>I'm here to chew bubble gum and make major pips...and I'm all out of bubble gum.<!

MightyOne wrote:I know how much you love it when I don't explain my shorthand
MO and other BM professionals. I have some thoughts about averaging in and exits regarding the chart MO posted.
I)
IF the line at 1.607x is an exit and the entry is below 1.45678 i believe what MO does is he already kn ows where he exits when he places the initial entry and then knowing he will average 7 times he divides the distance between his averages into set intervals. im just comparing this to another chart where he uses the exact same pattern.
In the chart it says 1 for 4, 3 for 7, 2 for 3
so if my initial entry is 40000 units, i add 10000, then 3 for 7 of my initial unit or my accumulated units?
III)
What does it mean to exit on extremes? Does it mean prior support/resistance area on the weekly chart? So in this case would it be around the 1.67xx area which is a clear resistance? a little more detailed explanation would be appreciated.
1) A unit is just a "standard" size...not necessarily a standard lot though!!! I think normal unit size is 4.5-5% risk
2) I don't see this one
3) Exit on extremes means to exit on the extreme of a day/week/month. If you're long, shoot to exit on high extremes for example. You can also exit on a new high, which will always be an extreme (but not always the other way around)
2) I don't see this one
3) Exit on extremes means to exit on the extreme of a day/week/month. If you're long, shoot to exit on high extremes for example. You can also exit on a new high, which will always be an extreme (but not always the other way around)
1)my question is to clarify the meaning of 1 for 4 , 3 for 7. lets say my initial entry is 40000 size/units/your choice of nomenclature then 1 for 4 would mean i add 10000 for every 40000 correct? and the 7 in the "3 for 7 ratio" stands for the initial 40000 or the accumulated size after the 1 for 4 stack?
2):-({|=
3) if im long off the yearly low extreme, i will always be at a year high extreme when it goes for me in profit, but that doesnt mean ill just exit.
2):-({|=
3) if im long off the yearly low extreme, i will always be at a year high extreme when it goes for me in profit, but that doesnt mean ill just exit.
Please add www.kreslik.com to your ad blocker white list.
Thank you for your support.
Thank you for your support.