newark18 wrote:MightyOne wrote:aliassmith wrote:MightyOne wrote:Uncertainty is a batch I know, good thing I don't need the money
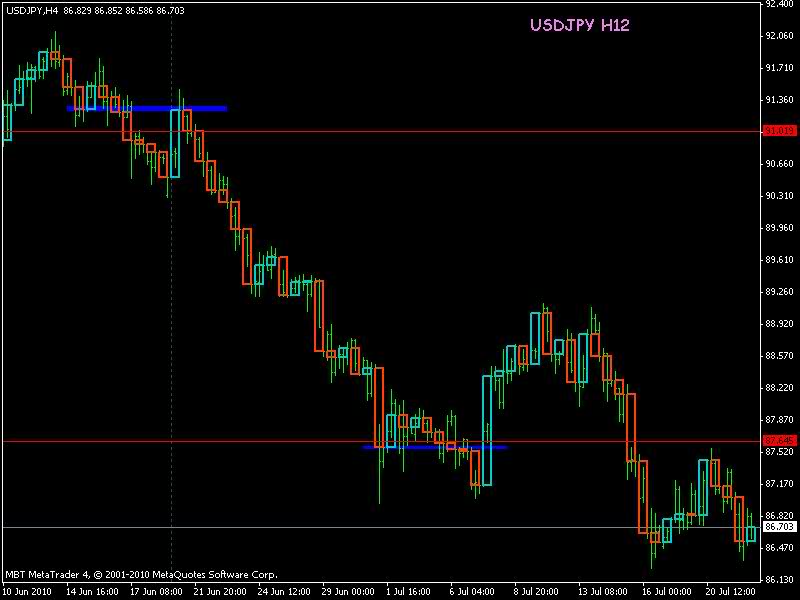
Based on this, S&R lines based on STF H1 candles as opposed to CCs.
Blind Mouse Strategy
Moderator: moderators
Please add www.kreslik.com to your ad blocker white list.
Thank you for your support.
- newark18
- rank: 500+ posts
- Posts: 562
- Joined: Thu Mar 11, 2010 3:32 am
- Reputation: 21
- Real name: J
- Gender:
MightyOne wrote:
At first glance, my reaction is huh? I thought S&R lines were derived from candle closes. And I see conflict between: (1) 50% mark is S&R used when doubling position; and (2) S&R line is your average price.
If someone who understands this chart can speak in nongenious terms then I would appreciate an explanation.
Failure is an opportunity to learn.
newark18 wrote:MightyOne wrote:
At first glance, my reaction is huh? I thought S&R lines were derived from candle closes. And I see conflict between: (1) 50% mark is S&R used when doubling position; and (2) S&R line is your average price.
If someone who understands this chart can speak in nongenious terms then I would appreciate an explanation.
If you double your position then your average price is the midpoint between your first and second order making a 50% RET your line of S&R...
Please add www.kreslik.com to your ad blocker white list.
Thank you for your support.
Any comments on my picture would be very helpful.
The top left blue line represents S&R. Large blue CC could not close above it, and price starts to move down. My potential entrance is the first red line.
Lower blue line is a new S&R. My exit is the red line, at the point where the large blue CC crosses over S&R line.
I believe I've got the concept of S&R. Determining the entrance/exit based on that is more difficult. This example is pretty clear cut, but how did I do on choosing my entrance/exit?
- newark18
- rank: 500+ posts
- Posts: 562
- Joined: Thu Mar 11, 2010 3:32 am
- Reputation: 21
- Real name: J
- Gender:
MightyOne wrote:newark18 wrote:MightyOne wrote:
At first glance, my reaction is huh? I thought S&R lines were derived from candle closes. And I see conflict between: (1) 50% mark is S&R used when doubling position; and (2) S&R line is your average price.
If someone who understands this chart can speak in nongenious terms then I would appreciate an explanation.
If you double your position then your average price is the midpoint between your first and second order making a 50% RET your line of S&R...
So I interpret what you wrote to mean that S&R lines are derived from your average price rather than how previous candles closed. I previously thought that we look to candle closes to derive our S&R lines and use them to protect our average price.
Failure is an opportunity to learn.
- aliassmith
- rank: 5000+ posts
- Posts: 5057
- Joined: Tue Jul 28, 2009 9:50 pm
- Reputation: 2847
- Gender:
MightyOne wrote:
Well you did hit the extreme I see. I don't believe I could of or would of
held the position like that. I definitly would have took profit at the place I
marked held profit. There was also nice entry near where I marked
resistance to go short again.
Guess "I" am more confortable trading from stops to stops, instead of
from stops to extremes.
Trade Your Way as Long as It Makes Money!
Please add www.kreslik.com to your ad blocker white list.
Thank you for your support.