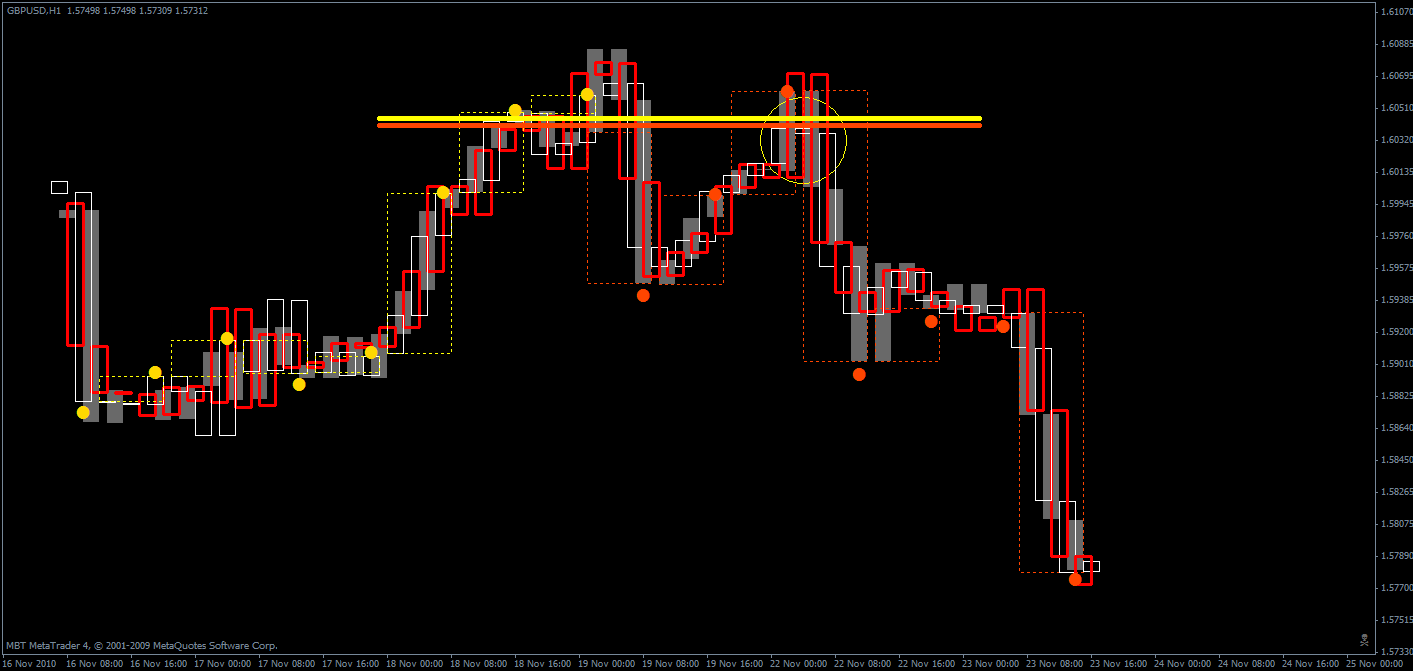
I've not managed to understand TROs dots yet. I think they have something to do with the dots MO uses. MOs dots show when a following custom candle has closed higher/lower than the leading candle - potential s/r.
Is this thread dead now, has everything moved on to box control?
Blind Mouse Strategy
Moderator: moderators
Please add www.kreslik.com to your ad blocker white list.
Thank you for your support.
Thank you for your support.


newscalper wrote:I've not managed to understand TROs dots yet. I think they have something to do with the dots MO uses. MOs dots show when a following custom candle has closed higher/lower than the leading candle - potential s/r.
Is this thread dead now, has everything moved on to box control?
MO dots = 9H CC (in this tf chart)
-
newscalper

- rank: 1000+ posts

- Posts: 1068
- Joined: Tue Oct 19, 2010 5:58 pm
- Reputation: 7
- Gender:

-
newscalper
- rank: 1000+ posts
- Posts: 1068
- Joined: Tue Oct 19, 2010 5:58 pm
- Reputation: 7
- Gender:
newscalper wrote:On page 113 though MO does circle the dots
and I think what he's showing is that the high of the white candle
is higher than the red leading candle, i.e. the last hour did not go
any higher, possible resistance.
Take that picture and draw the 2 big Custom candles (White and
Red) and see what is happening around the lines.
One thing that helped me to understand the 3CCs
(1CC+1CC+1CC) was take a sheet of paper and start to read the
market candle by candle, hope that helps
Please add www.kreslik.com to your ad blocker white list.
Thank you for your support.
Thank you for your support.
-
newscalper
- rank: 1000+ posts
- Posts: 1068
- Joined: Tue Oct 19, 2010 5:58 pm
- Reputation: 7
- Gender:
Here's the image. The dots show whether the CC closed higher or lower (just bodies don't let us see that so easy), I know that. MOs chart though has 2 dots - 1 for each colour CC and he WAS looking at both, I believe he wanted us to see something in the difference betwen the two. The other thing I see of course is the large CC closing above then below the line, and then the pullback entry at 3.
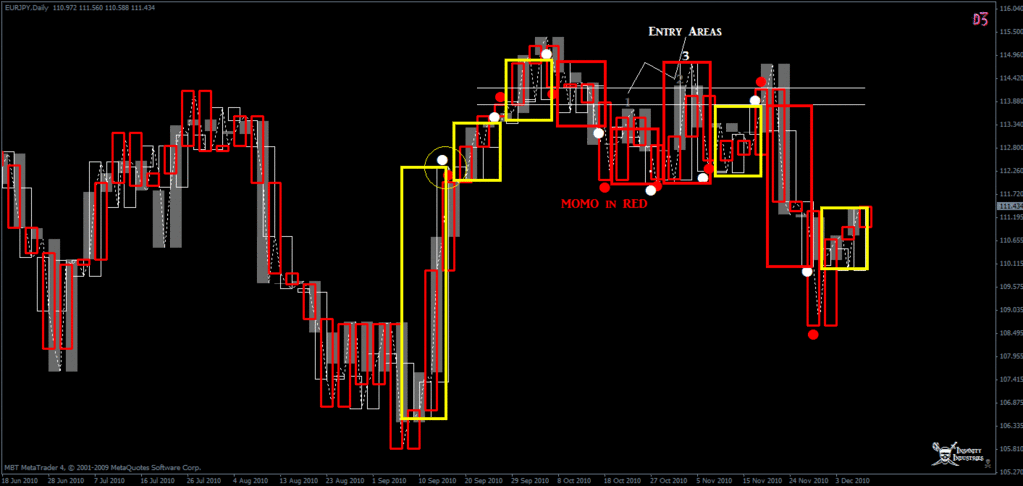


newscalper wrote:Here's the image. The dots show whether the CC closed higher or lower (just bodies don't let us see that so easy), I know that. MOs chart though has 2 dots - 1 for each colour CC and he WAS looking at both, I believe he wanted us to see something in the difference betwen the two. The other thing I see of course is the large CC closing above then below the line, and then the pullback entry at 3.


Please add www.kreslik.com to your ad blocker white list.
Thank you for your support.
Thank you for your support.