Hey TRO,
This "retrace" of the Daily low system seems pretty interesting. I just have a question...
Do we go long at the blue and short at the pink?? Do these highlighted areas point out the Daily high and low?
For example in this case we would go long at "1.48330" and short at "1.48940"
Is this right?
[img][img]http://i38.tinypic.com/qmywq1.jpg[/img][/img]
2009.11.05 DRAIN THE BANKS - REV 9
Moderator: moderators
-
PINKPANTHER5
- rank: 150+ posts

- Posts: 216
- Joined: Fri Feb 13, 2009 7:52 pm
- Reputation: 0
- Gender:

- Contact:
Please add www.kreslik.com to your ad blocker white list.
Thank you for your support.
Thank you for your support.
-
jonisonvespa
- rank: <50 posts

- Posts: 32
- Joined: Sun Oct 18, 2009 9:44 am
- Reputation: 0
- Gender:
-
TheRumpledOne

- rank: 10000+ posts

- Posts: 15564
- Joined: Sun May 14, 2006 9:31 pm
- Reputation: 3036
- Location: Oregon
- Real name: Avery T. Horton, Jr.
- Gender:
- Contact:
PINKPANTHER5 wrote:Hey TRO,
This "retrace" of the Daily low system seems pretty interesting. I just have a question...
Do we go long at the blue and short at the pink?? Do these highlighted areas point out the Daily high and low?
For example in this case we would go long at "1.48330" and short at "1.48940"
Is this right?
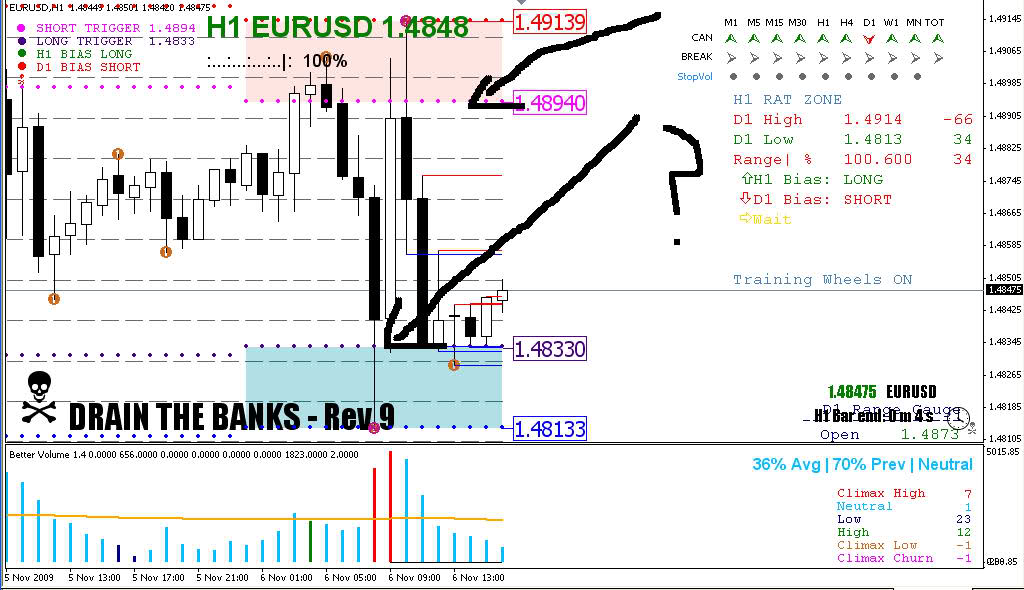
Yes. If you look at the legend in the top left-hand side of the chart you will see the triggers for long and short.
It is REVERSE OFF DAILY LOW not "retrace".
IT'S NOT WHAT YOU TRADE, IT'S HOW YOU TRADE IT!
Please do NOT PM me with trading or coding questions, post them in a thread.
Please do NOT PM me with trading or coding questions, post them in a thread.
-
PINKPANTHER5
- rank: 150+ posts
- Posts: 216
- Joined: Fri Feb 13, 2009 7:52 pm
- Reputation: 0
- Gender:
- Contact:
Please add www.kreslik.com to your ad blocker white list.
Thank you for your support.
Thank you for your support.
Tro this is a pretty cool study. i checked this out on the euro futures contract (125,000 euros per contract) over the past 2 years and found some interesting results. keep in mind these are for the futures contract and priced in ticks (12.50/usd per tick) @ cme vs pips on fx.
i took the pullback from H and bounce from L for all up days (daily time frame) and down days. then ran it in a monte carlo simulator for 100,000 simulations and came up with the following:
On updays (green daily candle)
pullback from high >=20 ticks is 75%, Avg 43 ticks
bounce from low >=20 ticks is 74%, Avg 41 ticks
On downdays (red daily candle)
pullback from high >=20 ticks 75%, Avg 50 ticks
bounce from low >=20 ticks 79%, Avg 50 ticks
so in theory if you just trade 2x a day on the euro like you mentioned earlier, just a 1 lot from the day high and low you have roughly a 75% of making at least $500 for the day, 2 contracts $1000 and so on. This is all calculated on normal distribution. If you use lognormal, (smallest move from either extreme is 0 ie no move), the percentages are insanely good (90s). Lognormal is probably more accurate, but better to err on the side of caution and take the worse results.
long story short, this method definitely holds up mathematically.
side note, crude @ >= 25 ticks ($250, $10 per tick) is
green day
from H: 77%, From L: 81%
Red day
from H: 80%, From L: 84.5%
-
TheRumpledOne
- rank: 10000+ posts
- Posts: 15564
- Joined: Sun May 14, 2006 9:31 pm
- Reputation: 3036
- Location: Oregon
- Real name: Avery T. Horton, Jr.
- Gender:
- Contact:
Thanks.
Please do me a favor and post your findings here:
http://www.elitetrader.com/vb/showthrea ... number=131
Please do me a favor and post your findings here:
http://www.elitetrader.com/vb/showthrea ... number=131
IT'S NOT WHAT YOU TRADE, IT'S HOW YOU TRADE IT!
Please do NOT PM me with trading or coding questions, post them in a thread.
Please do NOT PM me with trading or coding questions, post them in a thread.
-
TheRumpledOne
- rank: 10000+ posts
- Posts: 15564
- Joined: Sun May 14, 2006 9:31 pm
- Reputation: 3036
- Location: Oregon
- Real name: Avery T. Horton, Jr.
- Gender:
- Contact:
-
roger_over

- rank: 50+ posts

- Posts: 85
- Joined: Sun Oct 11, 2009 7:28 am
- Reputation: 0
- Gender:

Avery I don't know how you put up with that guy CTrader @ET. I commend you sir . I have finally got my indis loaded and I am understanding the simplicity of this system ..Look forward to demo next week.Also are you still trading in Paltalk?If so Could I be invited please?
Thank you
Thank you
Genius is more often found in a cracked pot than in a whole one.
E. B. White
E. B. White
Please add www.kreslik.com to your ad blocker white list.
Thank you for your support.
Thank you for your support.