TheRumpledOne wrote:Is what so relative?
Yes, it would make a difference FROM WHERE YOU ARE (THE OBSERVER). But if you ALWAYS use the same broker to chart, then your statistics and performance will be relative to you.
However...
If the price is making a daily low on the NY time but not on the GMT time, then the NY trader may be in the trade while the GMT trader is waiting.
Yes, your "however..." comment gets to the heart of my question. The broker's time frame seems like it could matter depending on what market opening you are trading and your indicators' relation to that market's time.
Am I getting too Yalie?
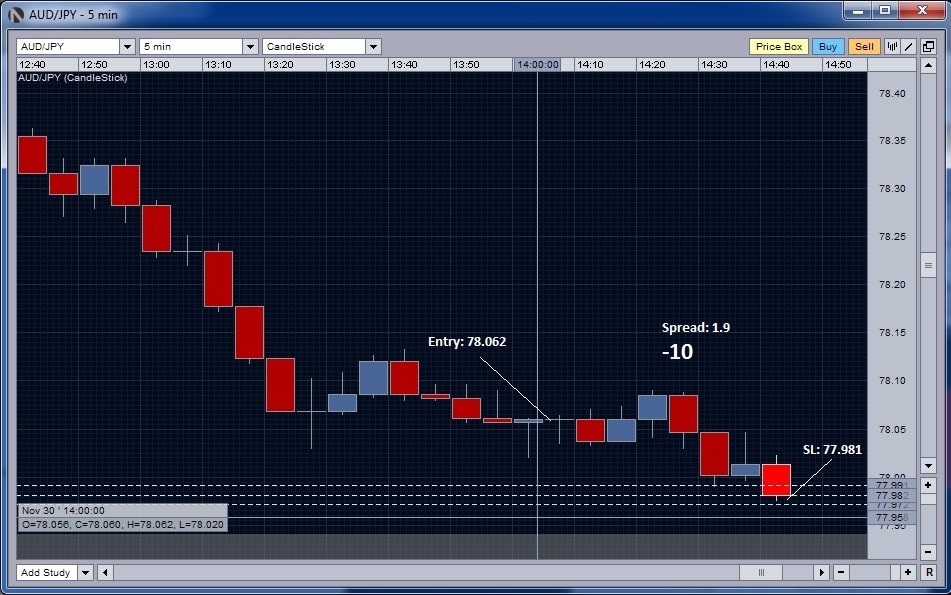
As an example, I'm trying to trade from the Rat Zone within 20 pips of the daily low. If that zone resets at a time that isn't GMT, will it matter? I know that rat reversals can work anywhere on the chart but trading from the edges seems to give an edge.