Heres the stats for the time at which the low happens on a green D1 bar, when that low is set before the the high, and the high or a red D1 bar.
Again I hope that it is readable.. If not I will try something else....
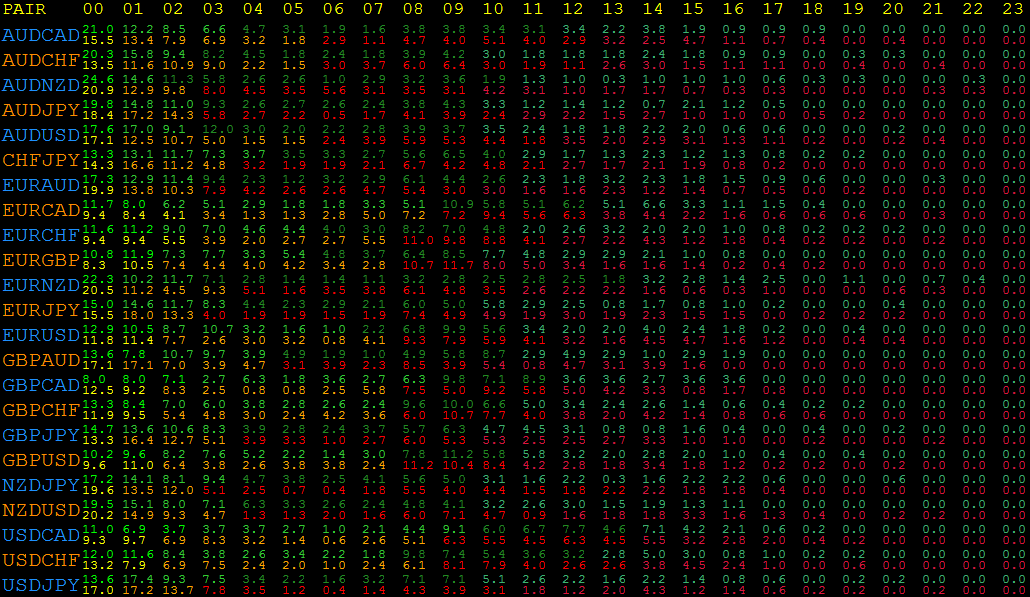
the numbers in the title are hours since D1 bar start, so 00 means "less than 1 hour" etc...
Colors are in order of <25% of bars, 25-50%,50-75% and 75%+, and just serve as a visual scan to see which pairs hit the hi/lo fastest.
edit: green bars on top, red on bottom, in case it wasnt immedialy obvious
Now my interpretation as to what I see on this....
Mostly the pairs that hit the opposite hi/lo first are the "asain" pairs JPY, AUD, and NZD which almost always hit during the asain session. In particular take a look at EURNZD, where the hit happens very early, and the pair is a big mover. ok, its got a spread of about 13 (11.3 - 14.4 as i look now, in the gap) but moves about 200 a day...
Next are the "euro" pairs, most of which see a spike in the first hour or so of the london session.
Next Observation: I had been waiting for the rat zones to separate before looking for RATs (in fact Ive been trading the RAT at about 9:30pm NZT, some 10 hours after daily open), it looks like there is no need to wait and the rat can be traded right from the asain open. In fact there may be a lot of lost potential by not trading the asain open....
This leads me to another question that may or may not show anything: wick distribution by hour. At a glance it would seem that hits in the first couple of hours would be bars with small wicks, while late hits are probably quite big.
It would not surprise me if the bars where the high is first for a green bar (low for red) are pinbars, or other long wick/small body bars providing potential for the opposing rat. I may have to check that too.
Anyway, new D1 in about an hour....
G.


