Bender
Moderator: moderators
- Jalarupa
- rank: 1000+ posts
- Posts: 1300
- Joined: Tue Feb 23, 2010 5:50 pm
- Reputation: 324
- Location: South Africa
- Gender:
Bender
Hi there guys,
Just wanna show some observations regarding the TROSBA indicator which was developed in light of Signal Bender's brief stint on Kreslik. I think it was gfg that mentioned the correlations to bredin, and I've been giving it a lot of thought since then.
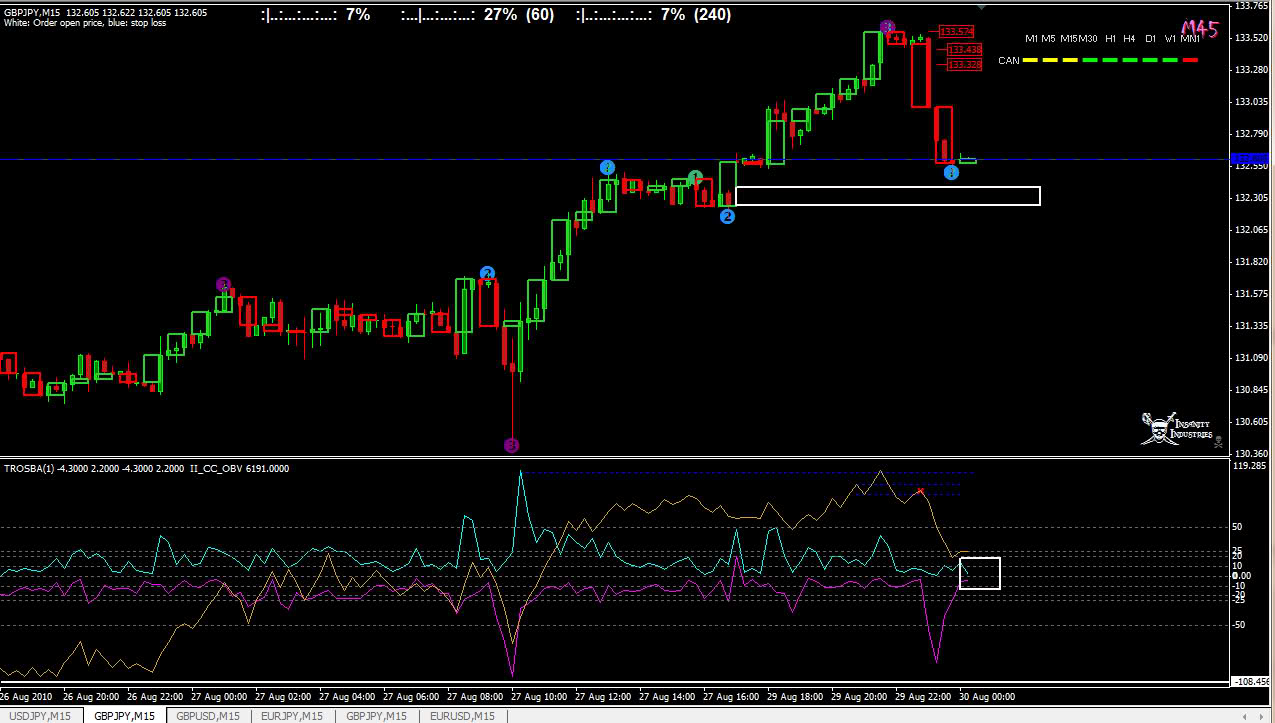
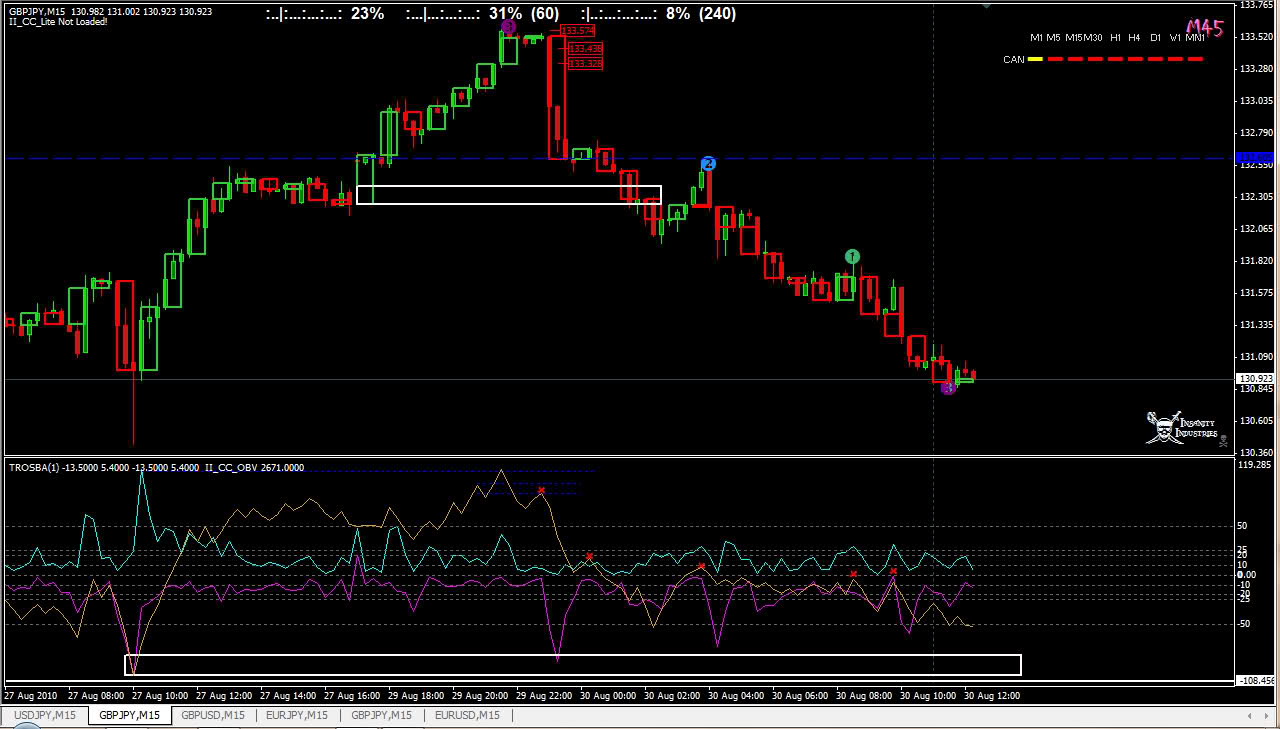
I have noted that there is definitely a powerful relationship between the OBV indicator and the highs and lows as well as the zero value of the TROSBA (which I set to range = 1)
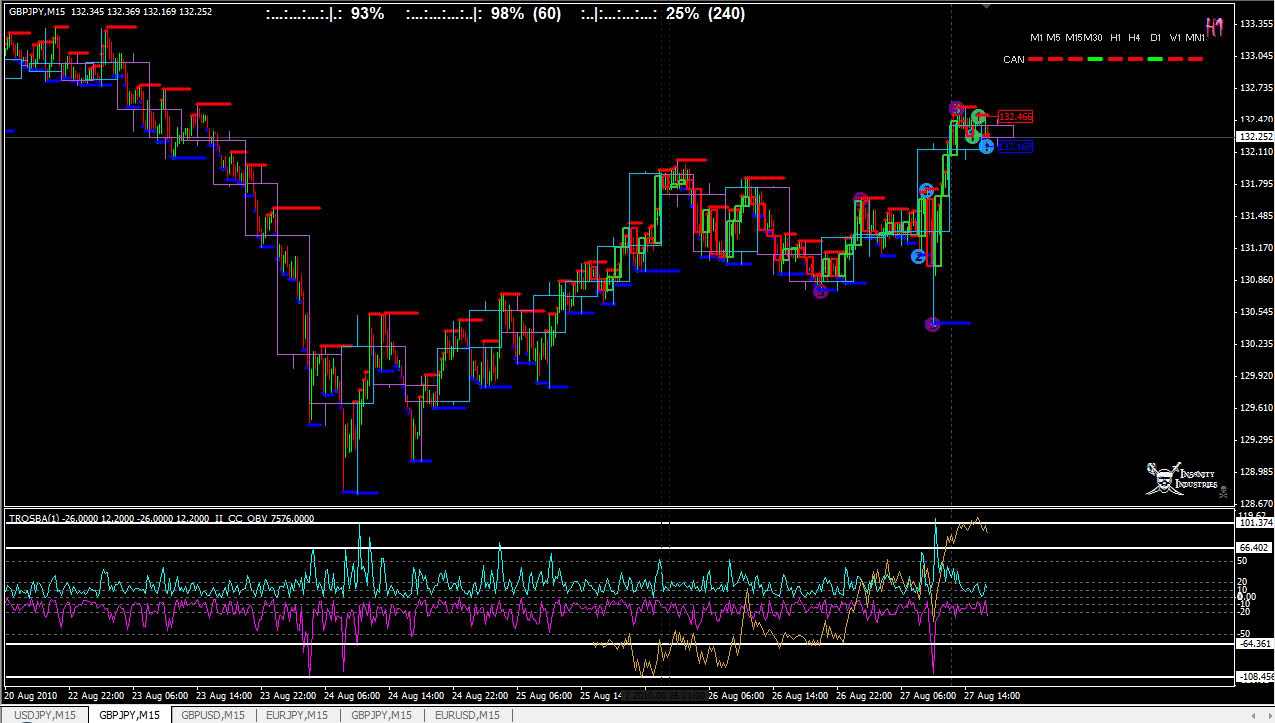
Here I took note of the various highs and lows that the TROSBA(1) drew over time
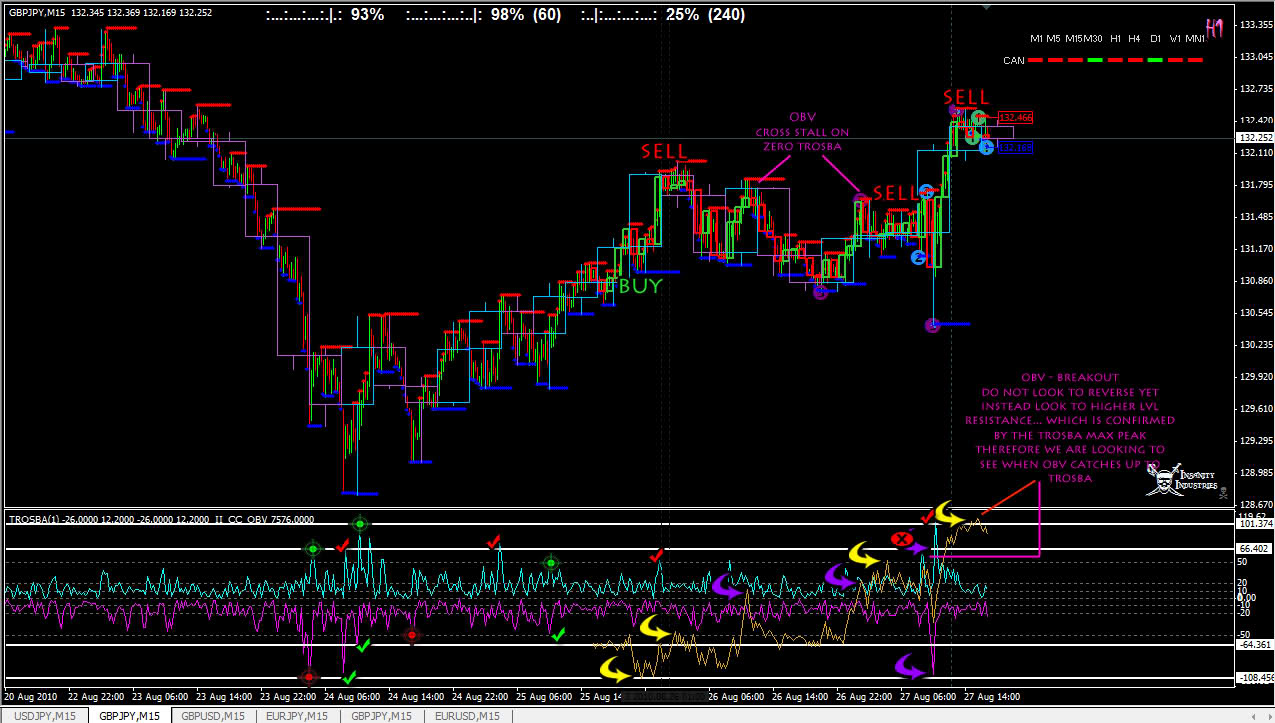
Next I marked where price (TROSBA) returned to these levels
Then I looked at then the OBV hit (yellow arrow) the same or near same levels and I made note of that, and look at the buy sell confirmations that were made...
Finally I looked at behavioral occurrences (purple arrow) where it hit btw zero & 20/-20 TROSBA. Also where SBA returned to extremes as well as when OBV broke out of the highest level - looking for a higher resistance...
I am still very interested in this whole market bio-rhythmic behavior and from what I can see these two indi's compliment eachother (thx gfg)
Now is there anyway someone could code this into a EA or a semafor to test this?
Please add www.kreslik.com to your ad blocker white list.
Thank you for your support.
- bredin
- rank: 1000+ posts
- Posts: 1033
- Joined: Mon Feb 16, 2009 10:41 pm
- Reputation: 7
- Gender:
- Contact:
Jal, can you clean up those charts so they show ONLY the information that you want, and the process by which you would generate a "trade signal" from that?
PM me on II and we can talk more about what defines a trade setup, Im not promising anything, but we can see what we come up with
G.
PM me on II and we can talk more about what defines a trade setup, Im not promising anything, but we can see what we come up with
G.
Welcome to the era of "Guns and Maskies" Trading!
The previous message contains discretion. Viewer nudity is advised.
Insanity Industries Indicators Here
Insanity Industries on YouTube!
The previous message contains discretion. Viewer nudity is advised.
Insanity Industries Indicators Here
Insanity Industries on YouTube!
- bredin
- rank: 1000+ posts
- Posts: 1033
- Joined: Mon Feb 16, 2009 10:41 pm
- Reputation: 7
- Gender:
- Contact:
theres a CC indi (Mine by the look of it) and a 3LZZ indi as well as TROs candlecolor indi and a couple of bartimers as well
G.
G.
Welcome to the era of "Guns and Maskies" Trading!
The previous message contains discretion. Viewer nudity is advised.
Insanity Industries Indicators Here
Insanity Industries on YouTube!
The previous message contains discretion. Viewer nudity is advised.
Insanity Industries Indicators Here
Insanity Industries on YouTube!
Please add www.kreslik.com to your ad blocker white list.
Thank you for your support.
Awesome analysis jal.
doji, let me try to answer. In panel 2, add OBV (on balance volume) indicator, or bredins II_CC_OBV indi.
Also add, tro_signal bender average indicator. In the sb_average indicator, blank out the red and blue colors, leaving only aqua and magenta. In the inputs of same indi, set average bars to 1. This should get the same settings as jalarupa is using, right jal?
Bredin, in panel 2 of the attached chart, the white OBV line is the standard issue indi. The gold line is the II_CC_OBV. Somehow they are not matching up. Seems as if my settings are somehow wrong. Any thoughts?
Also Bredin, all that is needed is a multi pair alert dashboard (lol wish list item)
Jalarupa wrote:
My first Bender Trade...
+250 Pips so far - looking to target the white box at the Gap close or to take the OBV white box target at the ZERO TROSBA level...
- Attachments
-
- On Balance Volume.mq4
- (3.41 KiB) Downloaded 123 times
-
- TRO_SignalBenderAvg.mq4
- (6.12 KiB) Downloaded 137 times
-
- gj bender.gif (22.64 KiB) Viewed 4634 times
Price closed over a line that you believed to be support and that is the first indication that something is WRONG-MO
- bredin
- rank: 1000+ posts
- Posts: 1033
- Joined: Mon Feb 16, 2009 10:41 pm
- Reputation: 7
- Gender:
- Contact:
gfg1
The most recent version of mine should be ok as it uses the same code as the one from the mql codebase, and then builds the OBV CC's on top of that.
An earlier version did something weird that I couldnt trace, despite being functionally the same as far as I could tell. It looks like you are still using that version, which appears to have (or cause) spikes in the data.
G.
Welcome to the era of "Guns and Maskies" Trading!
The previous message contains discretion. Viewer nudity is advised.
Insanity Industries Indicators Here
Insanity Industries on YouTube!
The previous message contains discretion. Viewer nudity is advised.
Insanity Industries Indicators Here
Insanity Industries on YouTube!
bingo, thanks.
bredin wrote:gfg1
The most recent version of mine should be ok as it uses the same code as the one from the mql codebase, and then builds the OBV CC's on top of that.
An earlier version did something weird that I couldnt trace, despite being functionally the same as far as I could tell. It looks like you are still using that version, which appears to have (or cause) spikes in the data.
G.
- Jalarupa
- rank: 1000+ posts
- Posts: 1300
- Joined: Tue Feb 23, 2010 5:50 pm
- Reputation: 324
- Location: South Africa
- Gender:
Hey GFG yes thats correct! Look at those confirmations on the TROSBA levels... TWICE on the ZERO LOL
Here's what the days trading looked like...
Looking to take the rest all the way to the OBV in the white box, until I will look at being long again... I AM ROBOT...
No rational for my entries... was merely trying to cover draw down from Friday. (BB-Before Bender) Looking for the D1 to close lower tomorrow to close my final DD in BE (luckily small position sizes)
So far so good...
Please add www.kreslik.com to your ad blocker white list.
Thank you for your support.