BONZ. Using technical indicators to trade.

If you don't know where to start, start here! Don't be afraid to ask questions.

Moderator: moderators

User avatar
IgazI
rank: 1000+ posts
rank: 1000+ posts
Posts: 2016
Joined: Sat Feb 17, 2018 5:28 pm
Reputation: 1663
Gender: None specified

Re: BONZ. Using technical indicators to trade.

Postby IgazI » Sun Aug 21, 2022 6:29 pm

Stochastic 5, 3, 3: levels 82 and 18:

1: double top without touching lower bound: price is moving up

2: alternating between 82 and 18: non-directional

3: double bottom without touching upper bound: price is moving down

4: double top

5: double bottom

6: double top

7: alternating

8: alternating

If it is alternating then you can probably stick with the previous direction. . .

These are my initial thoughts having no experience with this indicator.


for_don.png
for_don.png (213.6 KiB) Viewed 3916 times
"Everything Should Be Made As Simple As Possible, But Not Simpler!"

Please add www.kreslik.com to your ad blocker white list.
Thank you for your support.

User avatar
Don_xyZ
rank: 1000+ posts
rank: 1000+ posts
Posts: 1163
Joined: Tue Dec 14, 2010 9:15 am
Reputation: 1022
Gender: None specified

Re: BONZ. Using technical indicators to trade.

Postby Don_xyZ » Mon Aug 22, 2022 3:32 am

Just in case we have someone new to trading who reads this thread... I've decided to give a few pointers on how to trade using Stoch according to the methods I described below (that I posted previously). Explanations in Red.


Don_xyZ wrote:Some of these are common but the others are not.

How to use oscillator.png

1-5 are the most common.

1 is Overbought/ oversold method
How trade using this? Generally...

Check where the market is heading (having a bias)
If the price cross the Overbought (the 70 black horizontal line), be prepared
When the price close below the 70 line, enter a buy trade
Vice versa for Oversold

2 is Momentum method

Check where the market is heading (having a bias)
If the price close above the Overbought (the 70 black horizontal line), enter a trade a buy trade
Vice versa for sell trade

3 power balance shift method

Check where the market is heading (having a bias)
If the price close above the 50 middle black horizontal line, enter a buy trade
Vice versa for sell trade

4 is hidden divergence method

Check where the market is heading (having a bias)
Check the indicator, make sure there is a lower low swings
Check the price, make sure there is a higher high swings
If all the conditions are met, then it's a good condition to enter a buy trade
Vice versa for sell trade

5 is divergence method

Check where the market is heading (having a bias)
Check the indicator, make sure there is a higher high swings
Check the price, make sure there is a lower low swings
If all the conditions are met, then it's a good condition to enter a buy trade
Vice versa for sell trade

How to use oscillator 2.png

How to use oscillator 3.png

6 to 9 are advanced stuff. 2 & 8 are different. 7-9 are my own stuff. There are more plays in my book but I'm too lazy to post them all lolz

6 is a pattern Stochastics method

Check where the market is heading (having a bias)
Check the indicator, is there a pattern forming? By a pattern, I mean any western chart pattern such as triangles, rectangle, M, W, triple top, triple bottom.
Enter a trade when the pattern is going to form the final leg. If you are not familiar with this concept then please check and refer to the trading method used for western chart pattern. There is a lot of them online.

7~9 are more complicated so I'm just gonna explain them briefly

7 is Inside Stochastics range method

Check where the market is heading (having a bias)
Check the indicator, make sure the oscillator do not touch or cross the Oversold/ Overbough levels.
Check the price, make sure the price is also in a state of rectangle.
Enter at the bounce or break or pullback of the price chart (not the indicator)

8 Is Chaotic Moment method

Check where the market is heading (having a bias)
Check the indicator, is there a pattern forming? By a pattern, I mean any western chart pattern such as triangles, rectangle, M, W, triple top, triple bottom.
Check the price, is the price doing something completely different than what the indicator is doing?
Enter at the bounce or break or pullback of the price chart (not the indicator)

9 is Simple Pattern Divergence method

Check where the market is heading (having a bias)
Check the indicator, is there indicator going into the opposite direction of where the price is going?
Check the price, is the price going into the opposite direction than the indicator?
Enter at the bounce or break or pullback of the price chart (not the indicator)


IgazI wrote:Stochastic 5, 3, 3: levels 82 and 18:

1: double top without touching lower bound: price is moving up

2: alternating between 82 and 18: non-directional

3: double bottom without touching upper bound: price is moving down

4: double top

5: double bottom

6: double top

7: alternating

8: alternating

If it is alternating then you can probably stick with the previous direction. . .

These are my initial thoughts having no experience with this indicator.


for_don.png


As expected from a veteran's trained eyes. You even caught on with my own advanced stuff even though you have no experience with this indicator before. I'll take the other stuff that you methioned for my learning.
My threads

Patterns Observation
post148989#p148989

BONZ
post151670#p151670

MENTAL FORTIFICATION
post168148#p168148

Image

User avatar
Don_xyZ
rank: 1000+ posts
rank: 1000+ posts
Posts: 1163
Joined: Tue Dec 14, 2010 9:15 am
Reputation: 1022
Gender: None specified

Re: BONZ. Using technical indicators to trade.

Postby Don_xyZ » Mon Aug 22, 2022 9:21 am

Now we gonna revisit Ichimoku Kinko Hyo...
Look like a mess even today. I'm going to see if I can use this masterpiece of an indicator. Many people are using it so obviously, I'm missing something.

EURUSDM5 Ichimoku.png
EURUSDM5 Ichimoku.png (86.04 KiB) Viewed 3862 times
My threads

Patterns Observation
post148989#p148989

BONZ
post151670#p151670

MENTAL FORTIFICATION
post168148#p168148

Image

User avatar
Don_xyZ
rank: 1000+ posts
rank: 1000+ posts
Posts: 1163
Joined: Tue Dec 14, 2010 9:15 am
Reputation: 1022
Gender: None specified

Re: BONZ. Using technical indicators to trade.

Postby Don_xyZ » Wed Aug 31, 2022 2:09 am

The reason why traders don't use OBOS on Stochastics is because:

1. They trade blindly at OBOS levels
2. They think OBOS needs some kind of "magic number" as their period of calculation for it to work
3. They think the OBOS level must be fiddled with to get the optimum indicator of market turns
4. They don't differentiate or rather, don't know how to differentiate market states
5. They use OBOS fanatically without the knowledge of other methods of using an oscillator
6. They think using an indicator, albeit a leading indicator, is lagging compared to the naked chart style
7. They think every market is the same

US30.cashM1 RIP OBOS.png
US30.cashM1 RIP OBOS.png (50.64 KiB) Viewed 3745 times


Mountains and mountains of orders died on the hill of the skull due to those mistakes.


Is there a way to save new souls from the potential suffering of seeing their orders butchered by the merciless market?
My threads

Patterns Observation
post148989#p148989

BONZ
post151670#p151670

MENTAL FORTIFICATION
post168148#p168148

Image

User avatar
Don_xyZ
rank: 1000+ posts
rank: 1000+ posts
Posts: 1163
Joined: Tue Dec 14, 2010 9:15 am
Reputation: 1022
Gender: None specified

Re: BONZ. Using technical indicators to trade.

Postby Don_xyZ » Sun Sep 18, 2022 3:02 am

MOBOS ORTHODOX

If you know how to use an indicator properly, you'll make a lot of pips.
Momentum will make you pips.
OBOS will make you pips.

The settings:
Default stochastic (5,3,3)
Main line is on
Signal line is off (set color to none)
Levels 20,30,70,80

How to use:
Candle close, Stoch above 20, buy. Overbought play.
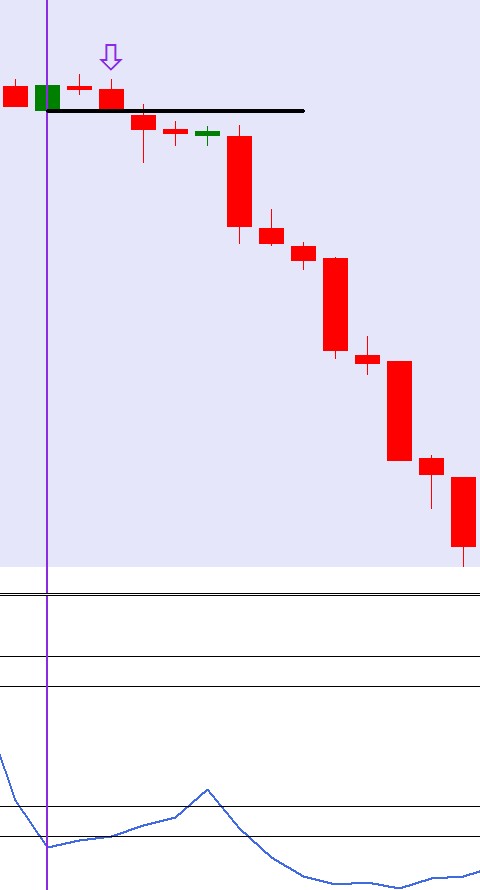
Candle close, Stoch below 80, sell. Oversold play.
Candle close, Stoc above 70, buy. Momentum play
Candle close, Stoc below 30, sell. Momentum play.
Anything else is up to your WIL.

You can use it as a scalping technique for 1 or 2 or 3 R but you can also use it for swing trade.

Sample potential trades:

Bullish momentum stoc method.jpg
Bullish momentum stoc method.jpg (24.17 KiB) Viewed 3615 times


Bearish momentum stoc method.jpg
Bearish momentum stoc method.jpg (24.63 KiB) Viewed 3615 times


Bullish overbought stoc method.jpg
Bullish overbought stoc method.jpg (50.72 KiB) Viewed 3615 times


Bearish overbought stoc method.jpg
Bearish overbought stoc method.jpg (46.1 KiB) Viewed 3615 times


There is no need for divergence and/ or hidden divergence because valid divergence/ hidden divergence most likely happen inside OBOS zone or momentum zone. Why OBOS zone? Because anything happening outside of OBOS zone is considered weak, we are looking for the time when the indicator's calculation reach the maximum/minimum levels. Plus, divergence/hidden divergence don't happen that often in a trading session and in contrast, OBOS will happen many times during a trading session.

Bullish divergence stoc method.jpg
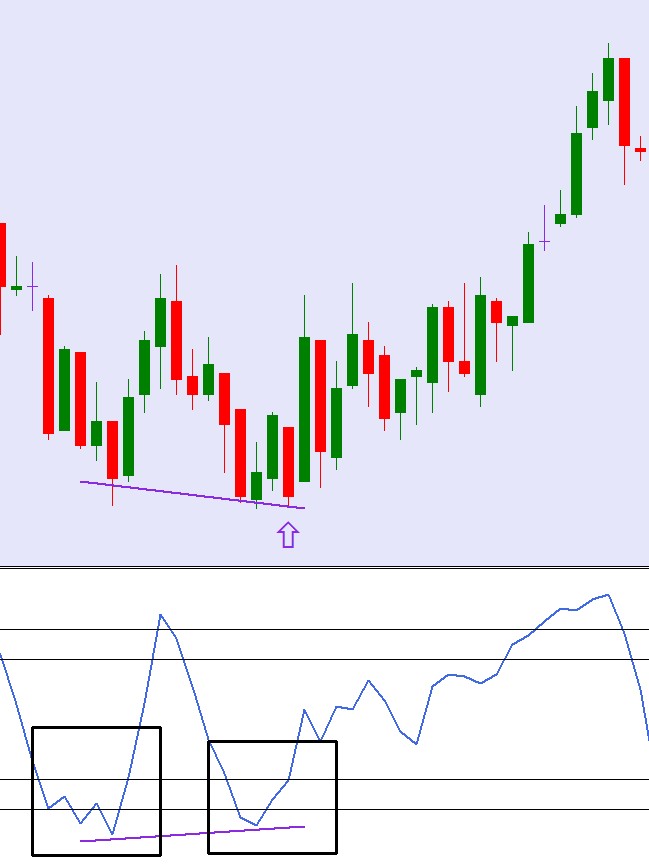
Bullish divergence stoc method.jpg (52.13 KiB) Viewed 3615 times


Bearish divergence stoc method.jpg
Bearish divergence stoc method.jpg (37.53 KiB) Viewed 3615 times


With MOBOS ORTHODOX, you can see where the price will go next?*


*up to some degree.
My threads

Patterns Observation
post148989#p148989

BONZ
post151670#p151670

MENTAL FORTIFICATION
post168148#p168148

Image

Please add www.kreslik.com to your ad blocker white list.
Thank you for your support.

User avatar
Don_xyZ
rank: 1000+ posts
rank: 1000+ posts
Posts: 1163
Joined: Tue Dec 14, 2010 9:15 am
Reputation: 1022
Gender: None specified

Re: BONZ. Using technical indicators to trade.

Postby Don_xyZ » Sat Oct 08, 2022 6:06 am

8 EMA, 21 EMA
Nial Fuller EMA.png
Nial Fuller EMA.png (70.32 KiB) Viewed 3429 times


20 SMA, 200 SMA
Oliver Velez SMA.png
Oliver Velez SMA.png (65.08 KiB) Viewed 3429 times


21 EMA, 55 EMA
Anonym.png
Anonym.png (65.98 KiB) Viewed 3429 times


8 EMA
Anonym 2.png
Anonym 2.png (65.59 KiB) Viewed 3429 times


Everyone is using a different combination trying to find the best possible trigger. Some are more aggressive, others are conservative. The important though is how to use it optimally for swings or scalp. Nial and Oliver's methods are readily available on the internet while the other two I forgot where I found them but both of them are used for scalping by crossover.
My threads

Patterns Observation
post148989#p148989

BONZ
post151670#p151670

MENTAL FORTIFICATION
post168148#p168148

Image

User avatar
aliassmith
rank: 5000+ posts
rank: 5000+ posts
Posts: 5057
Joined: Tue Jul 28, 2009 9:50 pm
Reputation: 2847
Gender: Male

Re: BONZ. Using technical indicators to trade.

Postby aliassmith » Sat Oct 08, 2022 6:29 am

Don_xyZ wrote:8 EMA, 21 EMA
Nial Fuller EMA.png

20 SMA, 200 SMA
Oliver Velez SMA.png

21 EMA, 55 EMA
Anonym.png

8 EMA
Anonym 2.png

Everyone is using a different combination trying to find the best possible trigger. Some are more aggressive, others are conservative. The important though is how to use it optimally for swings or scalp. Nial and Oliver's methods are readily available on the internet while the other two I forgot where I found them but both of them are used for scalping by crossover.


I don’t recall OV being a crossover method. They are reference points.

As an example

If below a sloped 200 and the sloped 20 is below the 200 look for shorts. Then he uses various candle patterns as triggers.
Trade Your Way as Long as It Makes Money!

User avatar
Don_xyZ
rank: 1000+ posts
rank: 1000+ posts
Posts: 1163
Joined: Tue Dec 14, 2010 9:15 am
Reputation: 1022
Gender: None specified

Re: BONZ. Using technical indicators to trade.

Postby Don_xyZ » Sat Oct 08, 2022 10:03 am

aliassmith wrote:
Don_xyZ wrote:8 EMA, 21 EMA
Nial Fuller EMA.png

20 SMA, 200 SMA
Oliver Velez SMA.png

21 EMA, 55 EMA
Anonym.png

8 EMA
Anonym 2.png

Everyone is using a different combination trying to find the best possible trigger. Some are more aggressive, others are conservative. The important though is how to use it optimally for swings or scalp. Nial and Oliver's methods are readily available on the internet while the other two I forgot where I found them but both of them are used for scalping by crossover.


I don’t recall OV being a crossover method. They are reference points.

As an example

If below a sloped 200 and the sloped 20 is below the 200 look for shorts. Then he uses various candle patterns as triggers.


Ah my bad, the sentence is not clear enough. The latter two, not Nial and OV, are used for crossover.
My threads

Patterns Observation
post148989#p148989

BONZ
post151670#p151670

MENTAL FORTIFICATION
post168148#p168148

Image

User avatar
Don_xyZ
rank: 1000+ posts
rank: 1000+ posts
Posts: 1163
Joined: Tue Dec 14, 2010 9:15 am
Reputation: 1022
Gender: None specified

Re: BONZ. Using technical indicators to trade.

Postby Don_xyZ » Sat Oct 08, 2022 12:13 pm

So... bands/ channel. Which one do you think is the better choice for swing trading or scalping?

Bollinger band.png
Bollinger band.png (107.5 KiB) Viewed 3386 times


Keltner channel.png
Keltner channel.png (99.36 KiB) Viewed 3386 times


Starc bands.png
Starc bands.png (112.94 KiB) Viewed 3386 times


Gonna revisit them later.
My threads

Patterns Observation
post148989#p148989

BONZ
post151670#p151670

MENTAL FORTIFICATION
post168148#p168148

Image

User avatar
Don_xyZ
rank: 1000+ posts
rank: 1000+ posts
Posts: 1163
Joined: Tue Dec 14, 2010 9:15 am
Reputation: 1022
Gender: None specified

Re: BONZ. Using technical indicators to trade.

Postby Don_xyZ » Sat Oct 15, 2022 2:32 pm

Don_xyZ wrote:So... bands/ channel. Which one do you think is the better choice for swing trading or scalping?

Bollinger band.png

Keltner channel.png

Starc bands.png

Gonna revisit them later.


For sure BB is the one mostly used by traders however, there are also good reasons to consider the other two because they use different things in their formulas. However, BB's bands are more dynamic and that is the reason why I prefer this band compared to the other two. There's a lot of trading strategies based on BB on the internet whether it's a single use or in conjunction with other indicator(s).
My threads

Patterns Observation
post148989#p148989

BONZ
post151670#p151670

MENTAL FORTIFICATION
post168148#p168148

Image

Please add www.kreslik.com to your ad blocker white list.
Thank you for your support.


Return to “beginners forum”