"Practically speaking, the most helpful thing about the fractal dimension is it gives us some idea what a chart is going to do next. This comes from the key observation that markets move in a steady rhythm between trend and congestion.
Understanding and watching the progression of this rhythm, using the fractal dimension to quantify it, can give us a good idea what a market is likely to do next.
If a market has been in a long period of congestion -- with a high reading on the fractal dimension -- then we can assume that the next major move will be a trend. We can also use the fractal dimension to recognize when the market is "self-organizing" itself into a trend, which is the way a market evolves and adapts to new energy (money) coming into or out of the system. When the fractal dimension moves from high levels down through 55, we have a good idea that a trend is starting, and that it will likely continue down towards the 30 area, where trends tend to lose energy and stop.
Conversely, when a trend has reached a fractal dimension reading of 30, we have a pretty good idea that the trend has run its course, and a consolidation or retracement is now about to unfold. The fractal dimension readings then move up during congestion periods.
Of course, there are always exceptions and outliers, but those can be cataloged too. A financial market always needs to be approached with the mindset that we can never know exactly what it will do, but we can have a pretty good idea about how it will adapt and evolve, greatly increasing the likelihood of success."
Fractal Dimensions

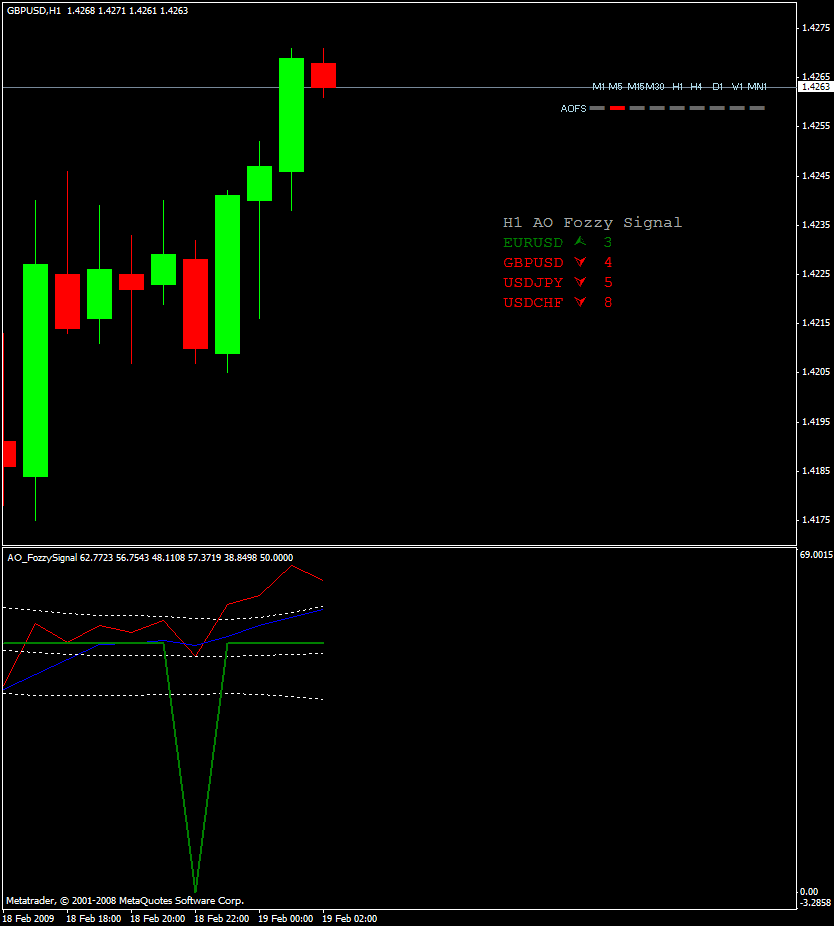
The Daily Fozzy MultiPairs shows the number of bars since a Fozzy Signal was generated. Of course ( green = long, red = short ). This was originally for the daily chart but I also created a MultiMeter.
Daily Fozzy Method

