MightyOne wrote:There is no need to use P&F charts unless that is what you really want to do.
When price touches a 250 level then you can use that as an extreme instead of using a weekly+.
If price moves beyond the 250 then you can look to intercept price with space drawn from a +125.
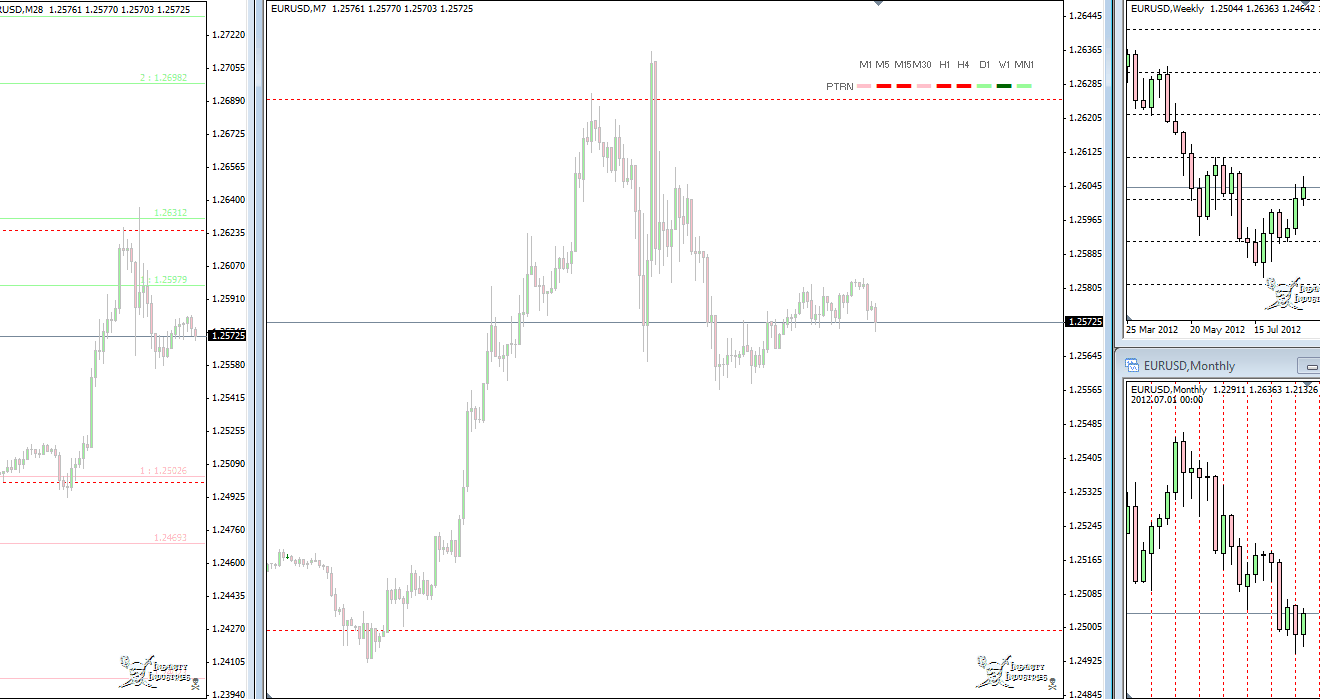
I think that I am going to stick with candle charts for the foreseeable future:
7 minute, 28 minute, weekly, monthly.
I have been going back and forth on whether or not I should include the 28 minute chart as the monthly is not of great importance.
OK, I'll bite... what is the reason behind using 7 minute charts, MO?