
The current situation is expressed with some chaotic determinants in the chart below.
EURJPY, when returns to 105.16 will be not to recover from but should lose more ground.
A small trigger down and then semafor3 repainted. See those arrows down of the vector orientation field. They showed at the US opening yesterday but not much happened as yet.
Below 105.16 there is a UPO @ 104.55.
The 5.8664 target was calculated from a sizeable trigger up of 62 pips. Its 9.1299 level is at 108.44.
My new chaos findings implemented in forex trading
Moderator: moderators
EURJPY as on 23.02
- Attachments
-
- eurjpy23.02.gif (40.21 KiB) Viewed 2282 times
Please add www.kreslik.com to your ad blocker white list.
Thank you for your support.
Thank you for your support.
CHFPLN
CHFPLN.
The trigger down marked here plays a major role now.
Its expansions by 3.5699
4.669
and 5.8664
showed as clear borders of chaos.
Both 4.669 and 5.8664 served as selling levels.
Last week ended with a bearish tone and more gains of the zloty are possible.
That more is 9.1299 of the same trigger which gives 3.3680.
This bearishness clashes with the overall outlook for EURUSD.
A new trigger up for CHFPLN is marked there and its 4.669=3.4365.
- Attachments
-
- chfpln4.03x.gif (27.47 KiB) Viewed 2217 times
-
- chfpln4.03.gif (26.09 KiB) Viewed 2218 times
EURUSD
EURUSD closed near 5.8664 and there is little to be said about a bounce off these lows. Last week closed bearish. Major players did not show any signs of disquietness.
There are more things about the behavior of a chaotic system to be revealed. By more I mean something really new.
To begin with I point to the 3.5699 multiplier which corresponds to the edge of a little head on the left side of the Mandelbrot set just before a spike. http://upload.wikimedia.org/wikipedia/c ... cation.jpg
This 3.5699 also corresponds to the edge of a mutant fractal derived from a unit fractal. Its first exponential expansion gives a factor of 9.6886 which is
near 9.1299, yet it is not the same. In chaos I am used to precision. Determinism is very precise by nature.
To see what I got with 9.6886 I suggest one deep breath and a look at the chart below.
There you have a trigger up from February 16.
Its 9.6886 expansion gives 1.3485 and that price level occurred exactly twice and no more pips.
EURUSD plummeted from 1.3485 300 pips.
- Attachments
-
- eurusd4.03.gif (25.08 KiB) Viewed 2215 times
-
- eurusd4.03x.gif (21.78 KiB) Viewed 2215 times
-
- eurusd4.03xx.gif (28.58 KiB) Viewed 2215 times
KGHM - the Polish copper giant
KGHM was recently lifted above 14.208 to over 152.00 per share. From 149.60 to 152.00 during five consecutive sessions KGHM was sold what looked like a mere consolidation. In fact it had been stretched far too much from the point of view of chaotic behavior and a trigger up. That too much means a lot of investors were caught unaware. What did OFE? Who knows. Maybe they did something, maybe they hold it which is more probable. They cash enough money for doing nothing most of the time.
Well, the new scenario underway is of a different colour.
Well, the new scenario underway is of a different colour.
- Attachments
-
- kghm6.03.gif (22.67 KiB) Viewed 2196 times
Please add www.kreslik.com to your ad blocker white list.
Thank you for your support.
Thank you for your support.
EURUSD as on 6.03
EURUSD has plummeted 14.208 times a trigger down to the level of 1.3119.
If you recall what I wrote about last week's ending, nothing pointed to EURUSD going higher.
If you recall what I wrote about last week's ending, nothing pointed to EURUSD going higher.
- Attachments
-
- eurusd6.03.gif (20.25 KiB) Viewed 2194 times
CHFPLN on the way to 3.4700
CHFPLN on the way to 3.4700.
- Attachments
-
- chfpln6.03.gif (21.97 KiB) Viewed 2191 times
TURK30 H1 as on 6.03
TURK30 H1 as on 6.03
- Attachments
-
- turk30(6.03).gif (24.35 KiB) Viewed 2189 times
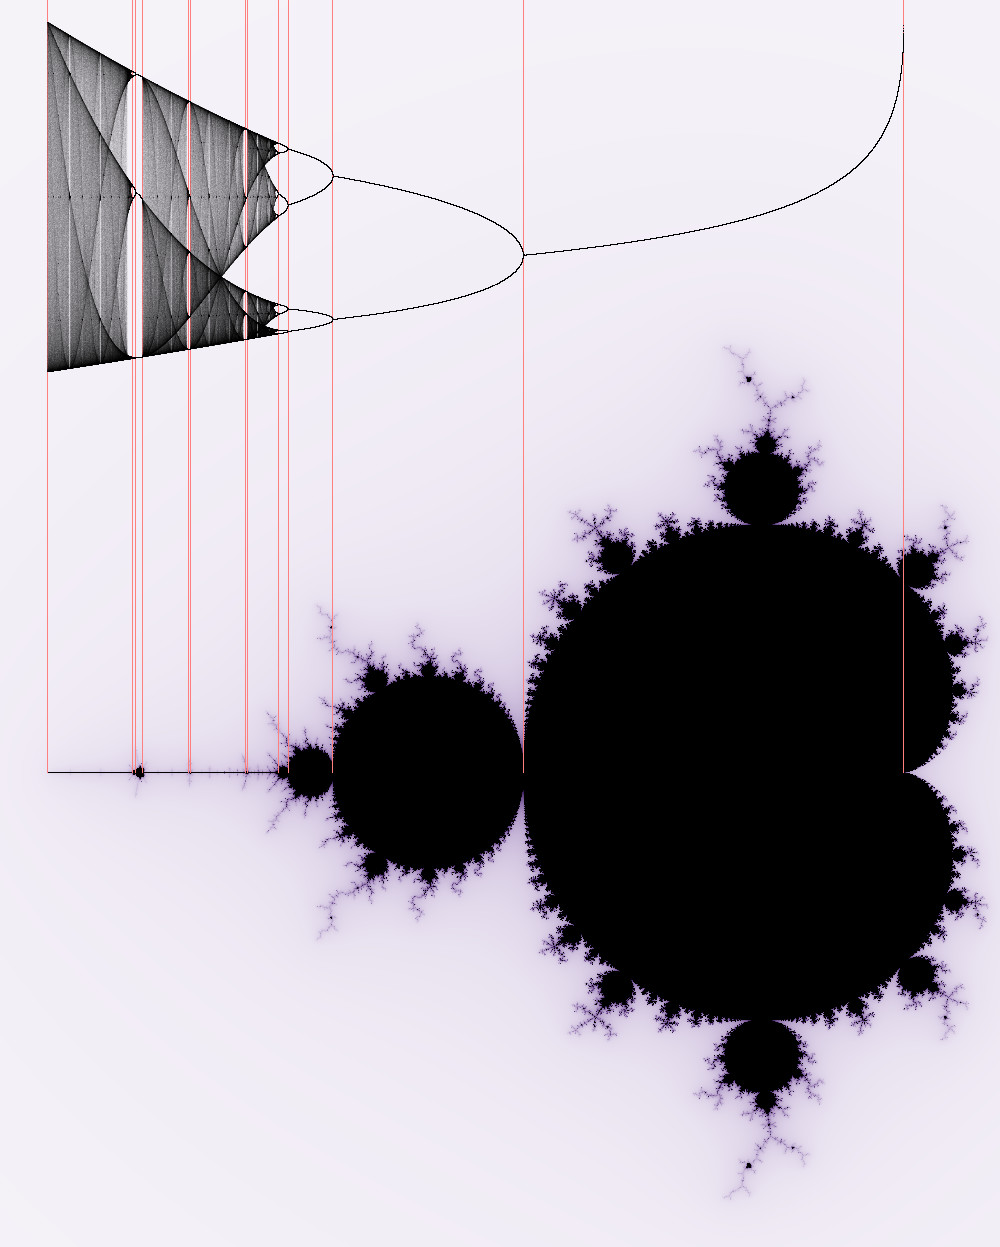
EURJPY and the Mandelbrot set
EURJPYas 0n 6.03.
In these circumstances refer to 3.5699 what it is in Mandelbrot set.
http://upload.wikimedia.org/wikipedia/c ... cation.jpg
That's where the shaded area begins in the top part of the logistic map).
It corresponds to the beginning of the spike in the Mandelbrot set.
That's where it is.
See it and remember it.
Keep it in your memory.
It is important.
It is important in the first place for the reason that the Mandelbrot set is a natural thing.
It is the nature of financial markets.
There is no such thing like greed, fear or joy in that set printed somewhere there inside, hidden or encoded.
Yet,it contains all greed, fear and joy of all the people from all over the world.
We cannot see the inside.
All we see are some shapes protruding from the inside.
The spike is remarkable.
Under magnification you will see many more replicas of the same Mandelbrot set.
Looks like all that greed, fear and joy can replicate on their own.
Those who missed the link here I am giving it again: http://upload.wikimedia.org/wikipedia/c ... cation.jpg
- Attachments
-
- eurjpy6.03.gif (22.67 KiB) Viewed 2184 times
Please add www.kreslik.com to your ad blocker white list.
Thank you for your support.
Thank you for your support.