BTCUSD and XRPUSD Technical Analysis – 17th JAN 2023 BTCUSD: Three Inside Up Pattern Above $17323
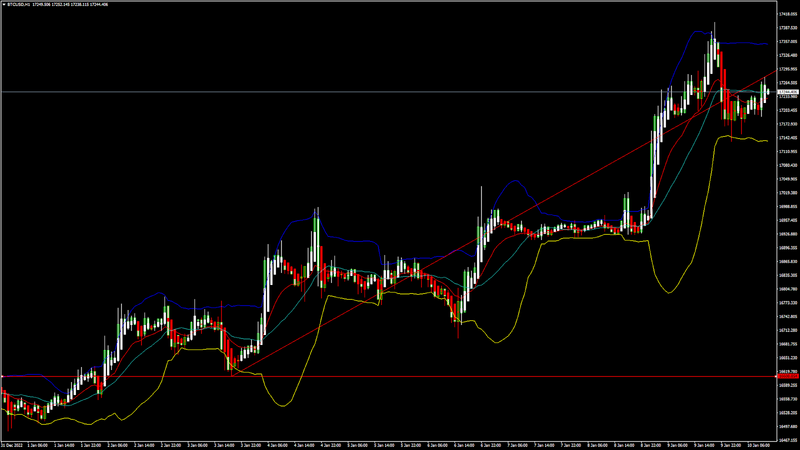
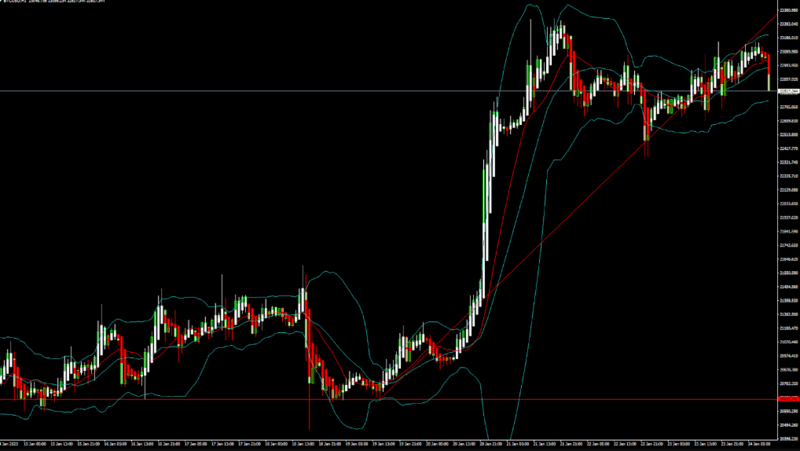
Bitcoin continues its bullish momentum from last week and after touching a low of $17323 on 11th Jan, the price started to correct upwards against the US Dollar and is now ranging above the $21000 handle in the European trading session today.
We can see an upwards rally in the BTCUSD which managed to touch the level of $21390 on 16th Jan.
We can clearly see a three inside up pattern above the $17323 handle which is a bullish reversal pattern because it signifies the end of a downtrend and a shift towards an uptrend.
Bitcoin touched an intraday high of 21288 and an intraday low of 20952 in the Asian trading session today.
The price of bitcoin is ranging near a new record high of 1 month.
The ichimoku is indicating a bullish crossover with tenkan and kijun in the 30-minute time frame.
Both the STOCH and Williams percent range are indicating overbought levels which means that in the immediate short term, a decline in the prices is expected.
The resistance of the channel is broken in the 15-minute time frame indicating bullish trends.
The relative strength index is at 72.09 indicating a very strong demand for bitcoin, and the continuation of the buying pressure in the markets.
Bitcoin is now moving above its 100 hourly simple moving average and above its 100 hourly exponential moving averages.
Most of the major technical indicators are giving a buy signal, which means that in the immediate short term, we are expecting targets of 22000 and 23500.
The average true range is indicating less market volatility with a strong bullish momentum.
- Bitcoin: bullish continuation seen above $17323
- The STOCHRSI is indicating an OVERSOLD level
- The price is now trading just below its pivot level of $21167
- The short term range is strongly bullish
Bitcoin: Bullish Continuation Seen Above $17323
The price of Bitcoin witnessed a rally after crossing the $18000 levels, and now we can see some market consolidation above the $21000 levels.
After the consolidation phase is over, we are expecting upside moves in the range of $22000 to $24000 levels.
There is an ascending channel forming with the current support at $17379 which is a 14-3 day raw stochastic at 20%.
We can see the formation of a bullish trend reversal pattern with the adaptive moving average AMA20 in the 15-minute time frame.
The immediate short-term outlook for bitcoin is strongly bullish, the medium-term outlook has turned bullish, and the long-term outlook remains neutral under present market conditions.
Bitcoin’s support zone is located at $18865 which is a 50% retracement from a 4-week high/low and at $19892 which is a 14-3 day raw stochastic at 70%.
The price of BTCUSD is now facing its classic resistance level of 21263 and Fibonacci resistance level of 21320 after which the path towards 22000 will get cleared.
In the last 24hrs BTCUSD has increased by 1.28% by 266.18$ and has a 24hr trading volume of USD 22.330 billion. We can see a decrease of 4.90% in the trading volume compared to yesterday, which appears to be normal.
The Week AheadBitcoin’s price rocketed higher recently and moved to a 2-month high crossing the $21000 levels. We are now looking for the next upwards move towards the $22000 and $24000 levels.
The daily RSI is printing at 86.91 which indicates a very STRONG demand for bitcoin and the continuation of the bullish phase present in the markets in the short-term range.
We can see the formation of a bullish trend line from $17323 towards the $21324 level.
The price of BTCUSD is now facing its resistance zone located at $21466 which is a 13-week high and $22981 which is a 3-10 day MACD oscillator stalls.
The weekly outlook is projected at $23000 with a consolidation zone of $22000.
Technical Indicators:The MACD (12,26): is at 689.90 indicating a BUY
The commodity channel index, CCI (14): is at 86.32 indicating a BUY
The rate of price change, ROC: is at 1.60 indicating a BUY
Bull/bear power (13): is at 593.30 indicating a BUY
Cryptocurrency CFDs are not available to retail clients in the UK Disclaimer: CFDs are complex instruments and come with a high risk of losing your money.