Daily analysis from FXOpen

forex live trades, setups, charts

Moderator: moderators

User avatar
whiteking
rank: 150+ posts
rank: 150+ posts
Posts: 350
Joined: Fri Aug 11, 2017 2:25 am
Reputation: 32
Gender: None specified

Re: Daily analysis from FXOpen

Postby whiteking » Wed Oct 19, 2022 5:41 am

EUR/USD and EUR/JPY Could Climb Further Higher

Image

EUR/USD is slowly moving higher above 0.9800. EUR/JPY is also rising and might climb further higher above the 147.25 zone.

Important Takeaways for EUR/USD and EUR/JPY
  • The Euro started a recovery wave and was able to clear the 0.9800 resistance zone.
  • There is a key bullish trend line forming with support near 0.9835 on the hourly chart.
  • EUR/JPY started a strong increase and settled well above the 145.50 zone.
  • There is a major bullish trend line forming with support near 146.90 on the hourly chart.
EUR/USD Technical Analysis

The Euro formed a base above the 0.9660 zone and started recovery wave against the US Dollar. The EUR/USD pair was able to clear the 0.9720 and 0.9750 resistance levels.

There was a clear move above the 0.9800 level and the 50 hourly simple moving average. The pair even climbed above 0.9850 and traded as high as 0.9875 on FXOpen. It is now consolidating gains near the 0.9850 zone.

Image

EUR/USD Hourly Chart

On the downside, the pair might find support near the 0.9835 level. Besides, there is a key bullish trend line forming with support near 0.9835 on the hourly chart. The trend line is near the 23.6% Fib retracement level of the upward move from the 0.9702 swing low to 0.9875 high.

The next major support sits near the 0.9810 level and the 50 hourly simple moving average, below which the pair could even test the 50% Fib retracement level of the upward move from the 0.9702 swing low to 0.9875 high.

If there is a downside break below the 0.9790 support, the pair might accelerate lower in the coming sessions. In the stated case, it could even test 0.9720.

On the upside, an immediate resistance is near the 0.9885 level. The next major resistance is near the 0.9920 level. The first major resistance is near the 0.9950 level. A clear move above the 0.9950 resistance might send the price towards 1.0000. If the bulls remain in action, the pair could revisit the 1.0050 resistance zone in the near term.

Disclaimer: CFDs are complex instruments and come with a high risk of losing your money.
I trade at FXOpen

Please add www.kreslik.com to your ad blocker white list.
Thank you for your support.

User avatar
whiteking
rank: 150+ posts
rank: 150+ posts
Posts: 350
Joined: Fri Aug 11, 2017 2:25 am
Reputation: 32
Gender: None specified

Re: Daily analysis from FXOpen

Postby whiteking » Thu Oct 20, 2022 1:51 pm

ETHUSD and LTCUSD Technical Analysis – 20th OCT, 2022

Image

ETHUSD: Bullish Harami Pattern Above $1263

Ethereum was unable to sustain its bearish momentum and after touching a low of 1205 on 13th Oct, the price started to correct upwards against the US dollar. The price of Ethereum touched a high of 1342 on 14th Oct after which we can see a shift towards the consolidation phase in the markets.

We have seen a bullish opening of the markets which indicates the present bullish trend.

We can clearly see a bullish harami pattern above the $1263 handle which signifies the end of a bearish phase and the start of a bullish phase in the markets.

ETH is now trading just above its pivot level of 1291 and moving into a mildly bullish channel. The price of ETHUSD is now testing its classic resistance level of 1294 and Fibonacci resistance level of 1296 after which the path towards 1300 will get cleared.

The relative strength index is at 47 indicating a neutral demand for Ether and a shift towards consolidation phase in the markets.

We can see that the Williams percent range is back over -50 indicating the bullish tone present in the markets.

The STOCHRSI is indicating an overbought market, which means that the price is expected to decline in the short-term range.

Some of the technical indicators are giving a STRONG BUY market signal.

Some of the moving averages are giving a BUY signal and we are now looking at the levels of $1350 to $1400 in the short-term range.

ETH is now trading below both the 100 & 200 hourly simple and exponential moving averages.
  • Ether: bullish reversal seen above the $1263 mark
  • Short-term range appears to be mildly bullish
  • ETH continues to remain above the $1200 level
  • The average true range is indicating LESS market volatility
Ether: Bullish Reversal Seen Above $1263
Image

ETHUSD is now moving into a mildly bullish channel with the price trading above the $1200 handle in the European trading session today.

ETH touched an intraday low of 1271 in the Asian trading session and an intraday high of 1294 in the European trading session today.

We can see the formation of a bullish harami pattern in the weekly time frame.

The commodity channel index is indicating a neutral level and fresh upsides are expected in the markets towards the 1300 handle.

Ethereum’s price continues to move into a bullish zone against the US dollar and is expected to move above the $1300 levels.

The daily RSI is printing at 43 indicating a weak demand in the long-term range.

The key support levels to watch are $1232 and $1251, and the price of ETHUSD needs to remain above these levels for the continuation of the bullish reversal in the markets.

ETH has decreased by 0.40% with a price change of 5.16$ in the past 24hrs and has a trading volume of 8.465 billion USD.

We can see a decrease of 15.87% in the total trading volume in the last 24 hrs which appears to be normal.

The Week Ahead

The price of Ethereum continues to remain well supported above the $1200 level, and has now started to move higher aiming at the $1300 level.

We can see the formation of a major bullish trend line in place from $1263 towards $1359 levels.

The immediate short-term outlook for Ether has turned mildly bullish, the medium-term outlook has turned neutral, and the long-term outlook for Ether is neutral in present market conditions.

The price of ETHUSD will need to remain above the important support level of $1273 which is a 38.2% retracement from 4-week low.

The weekly outlook is projected at $1400 with a consolidation zone of $1375.

Technical Indicators:

The average directional index ADX (14): is at 35.00 indicating a BUY

The ultimate oscillator: is at 69.59 indicating a BUY

Bull/bear power (13): is at 3.83 indicating a BUY

The commodity channel index (14): is at 59.91 indicating a BUY

Disclaimer: CFDs are complex instruments and come with a high risk of losing your money.
I trade at FXOpen

User avatar
whiteking
rank: 150+ posts
rank: 150+ posts
Posts: 350
Joined: Fri Aug 11, 2017 2:25 am
Reputation: 32
Gender: None specified

Re: Daily analysis from FXOpen

Postby whiteking » Mon Oct 24, 2022 5:49 am

GBP/USD Gains Momentum, EUR/GBP Eyes Fresh Increase

Image

GBP/USD started a recovery wave and climbed above the 1.1300 resistance. EUR/GBP is trading above the 0.8650 support and might eye a fresh increase.

Important Takeaways for GBP/USD and EUR/GBP
  • The British Pound started a fresh increase after it broke the 1.1250 resistance against the US Dollar.
  • There was a break above a major bearish trend line at 1.1290 on the hourly chart of GBP/USD.
  • EUR/GBP started a downside correction after it failed to clear the 0.8780 zone.
  • There was a break below a contracting triangle with support near 0.8720 on the hourly chart.
GBP/USD Technical Analysis

The British Pound found support near the 1.1050 zone against the US Dollar. The GBP/USD pair started a recovery wave and was able to clear the 1.1150 resistance zone.

There was a decent increase above the 1.1250 level and the 50 hourly simple moving average. The pair even climbed above the 1.1300 level. During the increase, there was a break above a major bearish trend line at 1.1290 on the hourly chart of GBP/USD.

Image

GBP/USD Hourly Chart

A high was formed near 1.1408 on FXOpen and the pair is now correcting gains. On the downside, an initial support is near the 1.1280 level. It is near the 38.2% Fib retracement level of the upward move from the 1.1061 swing low to 1.1408 high.

The next major support is near the 1.1235 level and the 50 hourly simple moving average. It is near the 50% Fib retracement level of the upward move from the 1.1061 swing low to 1.1408 high. Any more losses could lead the pair towards the 1.1180 support zone or even 1.1150.

On the upside, an initial resistance is near the 1.1350 level. The next main resistance is near the 1.1400 zone. A clear upside break above the 1.1400 and 1.1410 resistance levels could open the doors for a steady increase in the near term. The next major resistance sits near the 1.1500 level.


Disclaimer: CFDs are complex instruments and come with a high risk of losing your money.
I trade at FXOpen

User avatar
whiteking
rank: 150+ posts
rank: 150+ posts
Posts: 350
Joined: Fri Aug 11, 2017 2:25 am
Reputation: 32
Gender: None specified

Re: Daily analysis from FXOpen

Postby whiteking » Tue Oct 25, 2022 12:37 pm

BTCUSD and XRPUSD Technical Analysis – 25th OCT 2022
Image

BTCUSD: Bearish Engulfing Pattern Below $19685

Bitcoin was unable to sustain its bullish momentum and after touching a high of 19694 on 18th Oct, it started to decline touching a low of 18718 on 21st Oct.

We can see that bitcoin has made a failed attempt to cross the $20500 resistance on two separate occasions this month and is now back in the bearish zone.

We can see the formation of a bearish price crossover pattern with adaptive moving average AMA 20 and AMA 100 in the 4-hour time frame.

We can clearly see a bearish engulfing pattern below the $19685 handle which is a bearish reversal pattern because it signifies the end of an uptrend and a shift towards a downtrend.

Bitcoin touched an intraday low of 19252 in the Asian trading session and an intraday high of 19372 in the European trading session today.

Both the STOCH and Williams percent range are indicating overbought levels which means that in the immediate short term, a decline in the prices is expected.

The relative strength index is at 44 indicating a WEAKER demand for bitcoin, and the continuation of the selling pressure in the markets.

Bitcoin is now moving above its 100 hourly simple moving average and above its 200 hourly exponential moving averages.

Some of the major technical indicators are giving a SELL signal, which means that in the immediate short term, we are expecting targets of 19000 and 18500.

The average true range is indicating LESS market volatility with a mildly bearish momentum.
  • Bitcoin: bearish reversal seen below $19685
  • The STOCHRSI is indicating an oversold level
  • The price is now trading just below its pivot level of $19355
  • Some of the moving averages are giving a SELL market signal
Bitcoin: Bearish Reversal Seen Below $19685

Image

We can now see the progression of a falling trend channel in bitcoin as it is unable to hold onto its gains, and the increase in the selling pressure suggest we are now moving towards the $18000 handle.

The Aroon indicator is giving a bearish trend signal in the 1-hour time frame.

The MACD indicator is back under zero indicating the bearish trend in the 15-minute time frame.

The RSI indicator is also back under 50 indicating the weakness present in the markets.

The immediate short-term outlook for bitcoin is mildly bearish, the medium-term outlook has turned bearish, and the long-term outlook remains neutral under present market conditions.

Bitcoin’s support zone is located at $18577, the Camarilla support levels and the price needs to remain above this level for any potential of the bullish reversal in the markets.

The price of BTCUSD is now facing its classic support level of 19303 and Fibonacci resistance level of 19343 after which the path towards 18500 will get cleared.

In the last 24hrs, BTCUSD has decreased by 0.03% by 5$ and has a 24hr trading volume of USD 26.294 billion. We can see a decrease of 4.13% in the trading volume compared to yesterday, which appears to be normal.

The Week Ahead

The price of bitcoin is moving in a mildly bearish zone below the $19500 level. Further downside is projected at $18500 and $18000 as the immediate targets.

We have seen a bearish opening of the markets which suggests that we are poised for further declines this week below the $19000 levels.

The daily RSI is printing at 48 which indicates a neutral level and a move towards the consolidation phase in the markets.

The price of BTCUSD will need to remain above the important support level of $18000 this week.

The weekly outlook is projected at $18500 with a consolidation zone of $18000.

Technical Indicators:

The moving Averages Convergence Divergence MACD (12,26): is at -5.20 indicating a SELL

The commodity channel index CCI (14): is at -80.22 indicating a SELL

The rate of price change ROC: is at -0.16 indicating a SELL

The bull/bear power (13): is at 3-38.49 indicating a SELL

Disclaimer: CFDs are complex instruments and come with a high risk of losing your money.
I trade at FXOpen

User avatar
whiteking
rank: 150+ posts
rank: 150+ posts
Posts: 350
Joined: Fri Aug 11, 2017 2:25 am
Reputation: 32
Gender: None specified

Re: Daily analysis from FXOpen

Postby whiteking » Wed Oct 26, 2022 12:41 pm

EUR/USD Gathers Pace, USD/JPY Dips Below 150

Image

EUR/USD started a steady increase above the 0.9900 resistance zone. USD/JPY started a downside correction from the 152.00 resistance zone.

Important Takeaways for EUR/USD and USD/JPY
  • The Euro formed a base and started a decent upward move above the 0.9850 zone.
  • There is a major bullish trend line forming with support near 0.9910 on the hourly chart of EUR/USD.
  • USD/JPY declined sharply after it surged to a new multi-year high at 151.94.
  • There was a break below a key bullish trend line with support near 150.40 on the hourly chart.
EUR/USD Technical Analysis

This past week, the Euro found support near the 0.9700 zone against the US Dollar. The EUR/USD pair started a steady upward move above the 0.9800 and 0.9820 resistance levels.

There was a key increase above the 0.9900 resistance zone and the 50 hourly simple moving average. The pair even climbed above the 0.9950 resistance zone. A high was formed near 0.9977 on FXOpen and the pair is now consolidating gains.

Image

EUR/USD Hourly Chart

An initial support on the downside is near the 0.9950 level. It is near the 23.6% Fib retracement level of the upward move from the 0.9848 swing low to 0.9977 high.

The first major support is near the 0.9920 level. There is also a major bullish trend line forming with support near 0.9910 on the hourly chart of EUR/USD. The main support sits near the 0.9910 zone. It is near the 50% Fib retracement level of the upward move from the 0.9848 swing low to 0.9977 high.

An immediate resistance on the upside is near the 0.9980 level. The next major resistance is near the 1.0000 level. An upside break above 1.0000 could set the pace for another increase. In the stated case, the pair might revisit 1.0120. Any more gains might send the pair towards 1.0200.

Disclaimer: CFDs are complex instruments and come with a high risk of losing your money.
I trade at FXOpen

Please add www.kreslik.com to your ad blocker white list.
Thank you for your support.

User avatar
whiteking
rank: 150+ posts
rank: 150+ posts
Posts: 350
Joined: Fri Aug 11, 2017 2:25 am
Reputation: 32
Gender: None specified

Re: Daily analysis from FXOpen

Postby whiteking » Thu Oct 27, 2022 2:21 pm

#MarketNews #Meta #Stoks

META (FB) SHARES FALL 20% AFTER EARNINGS REPORT

The social media giant's profits have halved. A slight increase in the number of active users did not save the stock, Meta on the postmarket reached the lowest prices in more than 6 years, approaching the psychological mark of $100 per share.

On the eve of the report, one of the major institutional investors in META shares published an open letter to the company's management to halve investments in the metaverse. Meta's losses from the development of Reality Labs (the metaverse) in Q3 amounted to $3.7 billion.

However, Zuckerberg remains optimistic. In his opinion, the problems in income are short-term, there are prerequisites for a return to higher income growth. The company will make better use of employees and office space.

After the February report (1), the META (FB) stock price is in a steady bearish trend. Perhaps yesterday's report will strengthen the negativity. From a technical point of view, there is reason to believe that line (2) will work as resistance, and line (3) as support.

Investors are cautiously preparing for the publication of Apple and Amazon reports and are seeing an increase in the prices of shares of chip manufacturers — suppliers of capacities for the metauniverse under construction.

Image

Disclaimer: CFDs are complex instruments and come with a high risk of losing your money.

This forecast represents FXOpen Companies opinion only, it should not be construed as an offer, invitation or recommendation in respect to FXOpen Companies products and services or as financial advice.


Source FXOpen telegram channel
I trade at FXOpen

User avatar
whiteking
rank: 150+ posts
rank: 150+ posts
Posts: 350
Joined: Fri Aug 11, 2017 2:25 am
Reputation: 32
Gender: None specified

Re: Daily analysis from FXOpen

Postby whiteking » Fri Oct 28, 2022 7:17 am

AUD/USD and NZD/USD Aim More Upsides

Image

AUD/USD is moving higher and showing positive signs above 0.6400. NZD/USD is also rising and might aim more upsides above 0.5850.

Important Takeaways for AUD/USD and NZD/USD
  • The Aussie Dollar started a fresh increase above the 0.6350 and 0.6400 levels against the US Dollar.
  • There is a key bullish trend line forming with support at 0.6460 on the hourly chart of AUD/USD.
  • NZD/USD is showing a lot of bullish signs above the 0.5800 support zone.
  • There is a major bullish trend line forming with support at 0.5820 on the hourly chart of NZD/USD.
AUD/USD Technical Analysis

The Aussie Dollar formed a base above the 0.6200 level and started a fresh increase against the US Dollar. The AUD/USD pair gained pace above the 0.6300 level to move into a positive zone.

There was a clear move above the 0.6350 level and the 50 hourly simple moving average. The pair even climbed above the 0.6500 level and traded as high as 0.6522. It is now correcting gains and trading below the 0.6500 level.

Image

AUD/USD Hourly Chart

It spiked below the 23.6% Fib retracement level of the upward move from the 0.6210 swing low to 0.6522 high. On the downside, an initial support is near the 0.6460 level.

There is also a key bullish trend line forming with support at 0.6460 on the hourly chart of AUD/USD. The next support could be the 0.6400 level. If there is a downside break below the 0.6400 support, the pair could extend its decline towards the 0.6365 level.

The 50% Fib retracement level of the upward move from the 0.6210 swing low to 0.6522 high is also near 0.6365. On the upside, the AUD/USD pair is facing resistance near the 0.6500 level.

The next major resistance is near the 0.6520 level. A close above the 0.6520 level could start a steady increase in the near term. The next major resistance could be 0.6580.

Disclaimer: CFDs are complex instruments and come with a high risk of losing your money.
I trade at FXOpen

User avatar
whiteking
rank: 150+ posts
rank: 150+ posts
Posts: 350
Joined: Fri Aug 11, 2017 2:25 am
Reputation: 32
Gender: None specified

Re: Daily analysis from FXOpen

Postby whiteking » Mon Oct 31, 2022 9:04 am

GBP/USD Eyes Additional Gains, USD/CAD Could Start Fresh Increase

Image

GBP/USD is gaining pace above the 1.1500 resistance zone. USD/CAD is recovering and might rally if it clears the 1.3635 resistance zone.

Important Takeaways for GBP/USD and USD/CAD
  • The British Pound was able to move above the 1.1420 and 1.1500 resistance levels.
  • There is a key contracting triangle forming with resistance near 1.1615 on the hourly chart of GBP/USD.
  • USD/CAD tested the 1.3500 zone and started a recovery wave.
  • There is a major bearish trend line forming with resistance at 1.3625 on the hourly chart.
GBP/USD Technical Analysis

After forming a base above the 1.1200, the British Pound started a steady recovery wave against the US Dollar. GBP/USD gained pace for a move above the 1.1320 and 1.1420 resistance levels.

There was a move above the 1.1500 resistance and the 50 hourly simple moving average. The pair even moved above the 1.1600 level and traded as high as 1.1645 on FXOpen. It is now consolidating gains above the 1.1600 zone.

Image

GBP/USD Hourly Chart

Recently, there was a move below the 1.1600 and 1.1580 support levels. The pair declined below the 23.6% Fib retracement level of the upward move from the 1.1259 swing low to 1.1645 high.

It is now trading above the 1.1600 level and the 50 hourly simple moving average. An immediate resistance is near the 1.1615 level. There is also a key contracting triangle forming with resistance near 1.1615 on the hourly chart of GBP/USD.

The next resistance is near the 1.1650 level. The main resistance is near the 1.1700 level. If there is an upside break above the 1.1700 zone, the pair could rise towards 1.1880. The next key resistance could be 1.2000, above which the pair could gain strength.

On the downside, an initial support is near the 1.1550 area. The next major support is near the 1.1450 level. It is near the 50% Fib retracement level of the upward move from the 1.1259 swing low to 1.1645 high.

If there is a break below 1.1450, the pair could extend its decline. The next key support is near the 1.1322 level. Any more losses might call for a test of the 1.1250 support.

Disclaimer: CFDs are complex instruments and come with a high risk of losing your money.
I trade at FXOpen

User avatar
whiteking
rank: 150+ posts
rank: 150+ posts
Posts: 350
Joined: Fri Aug 11, 2017 2:25 am
Reputation: 32
Gender: None specified

Re: Daily analysis from FXOpen

Postby whiteking » Tue Nov 01, 2022 2:40 pm

BTCUSD and XRPUSD Technical Analysis – 01st NOV 2022

Image

BTCUSD: Inverted Hammer Pattern Above $19187

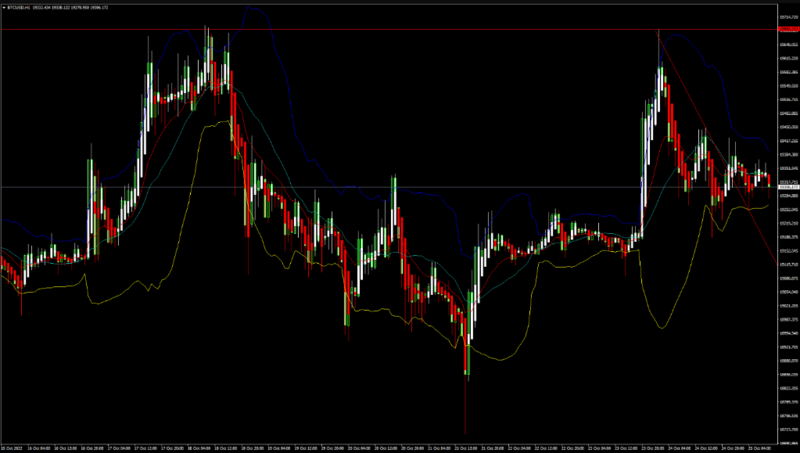
Bitcoin was unable to sustain its bearish momentum and after touching a low of 19187 on 24th Oct, the prices started to correct upwards crossing the $20500 handle.

We can see continued appreciation in the price of BTCUSD which is now trading above the 20500 in the European trading session today.

We can see the formation of a bullish harami pattern in the 30-minute time frame.

The resistance of the channel is broken in the 1-hourly time frame indicating the bullish tone of the markets.

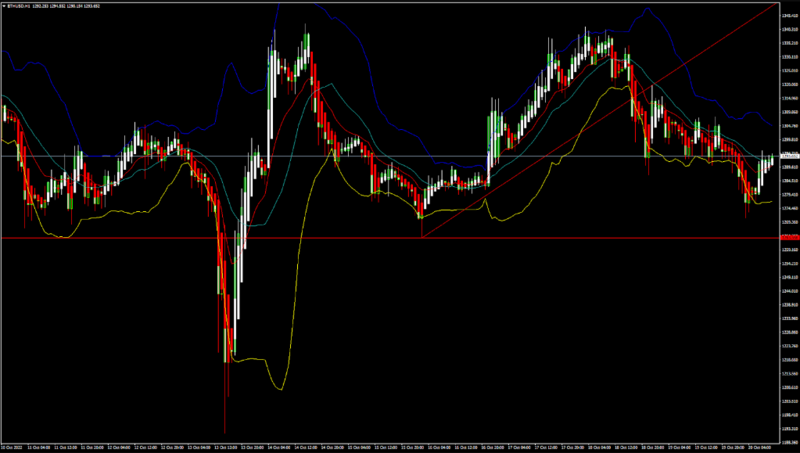
We can clearly see an inverted hammer pattern above the $19187 handle which is a bullish reversal pattern because it signifies the end of a downtrend and a shift towards an uptrend.

Bitcoin touched an intraday low of 20379 in the Asian trading session and an intraday high of 20657 in the European trading session today.

Both the STOCH and STOCHRSI are indicating overbought levels which means that in the immediate short term, a decline in the price is expected.

The relative strength index is at 53 indicating a NEUTRAL demand for bitcoin and a shift towards the consolidation phase in the markets.

Bitcoin is now moving above its 100 hourly exponential moving average and above its 200 hourly exponential moving averages.

Most of the major technical indicators are giving a STRONG BUY signal, which means that in the immediate short term, we are expecting targets of 21000 and 21500.

The average true range is indicating LESS market volatility with a mildly bullish momentum.
  • Bitcoin: bullish reversal seen above $19187.
  • The Williams percent range is indicating an overbought level.
  • The price is now trading just below its pivot level of $20607.
  • Most of the moving averages are giving a STRONG BUY market signal.
Bitcoin: Bullish Reversal Seen Above $19187

Image

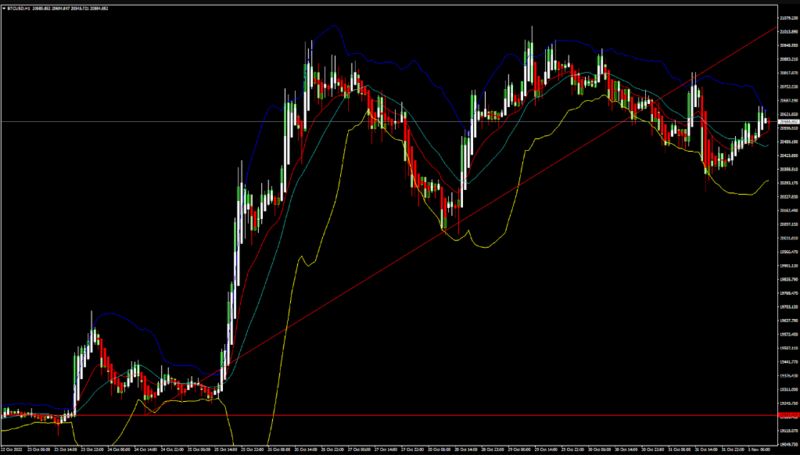
We can now see that the price of bitcoin rocketed higher recently towards the monthly high of 20969 on 29th Oct, and we can now witness the formation of an ascending channel in the markets.

Bitcoin’s price is super bullish against the US dollar and bitcoin and now we are aiming towards crossing the $21000 and $22000 levels soon.

The adaptive moving average AMA20 and AMA50 are giving a bullish trend reversal signal.

The price of bitcoin is back over the pivot point in the daily time frame indicating the bullish overtone present in the markets.

We have also seen a bullish opening of the markets this week.

The immediate short-term outlook for bitcoin is strongly bullish, the medium-term outlook has turned bullish, and the long-term outlook remains neutral under present market conditions.

Bitcoin’s support zone is located at $19637 which is a 50% retracement from a 4-week high/low and the price needs to remain above this level for the continuation of the bullish reversal in the markets.

The price of BTCUSD is now facing its classic resistance level of 20628 and Fibonacci resistance level of 20667 after which the path towards 21500 will get cleared.

In the last 24hrs, BTCUSD has increased by 0.25% by 51$ and has a 24hr trading volume of USD 45.266 billion. We can see an increase of 39.05% in the trading volume compared to yesterday, which is due to the heavy buying pressure seen in the global markets.

The Week Ahead

The price of bitcoin is moving in a strongly bullish zone above the $20500 levels. Further upsides are projected at $21500 and $22000 as the immediate targets.

Now we are aiming for $21710 which is a 50% retracement from 13 week high/low.

The daily RSI is printing at 59 which indicates a strong demand for bitcoin and the continuation of the buying pressure in the markets.

The price of BTCUSD will need to remain above the important support level of $20000 this week.

The weekly outlook is projected at $21500 with a consolidation zone of $22000.

Technical Indicators:

The moving averages convergence divergence MACD (12,26): is at 6.20 indicating a BUY.

The commodity channel index CCI (14): is at 138.28 indicating a BUY.

The rate of price change ROC: is at 1.22 indicating a BUY.

Bull/bear power (13): is at 128.67 indicating a BUY.

Disclaimer: CFDs are complex instruments and come with a high risk of losing your money.

Cryptocurrency CFDs are not available to retail clients in the UK
I trade at FXOpen

User avatar
whiteking
rank: 150+ posts
rank: 150+ posts
Posts: 350
Joined: Fri Aug 11, 2017 2:25 am
Reputation: 32
Gender: None specified

Re: Daily analysis from FXOpen

Postby whiteking » Wed Nov 02, 2022 6:40 am

EUR/USD Eyes Upside Break While USD/CHF Consolidates Gains

Image

EUR/USD is struggling to climb above the 0.9920 resistance zone. USD/CHF is consolidating gains above the 0.9950 support zone.

Important Takeaways for EUR/USD and USD/CHF
  • The Euro started a fresh decline and traded below the 0.9950 zone against the US Dollar.
  • There is a major bearish trend line forming with resistance near 0.9905 on the hourly chart of EUR/USD.
  • USD/CHF started a fresh increase after it was able to clear the 0.9920 resistance.
  • There is a key bullish trend line forming with support near 0.9950 on the hourly chart.
EUR/USD Technical Analysis

This past week, the Euro saw a major decline below the 0.9980 support against the US Dollar. The EUR/USD pair declined below the 0.9920 support level to move into a bearish zone.

The pair even tested the 0.9850 support zone. It is now forming a base above the 0.9850 level and is currently consolidating losses from the 0.9852 low formed on FXOpen. There was a minor recovery wave above the 0.9880 level.

Image

EUR/USD Hourly Chart

The pair climbed above the 23.6% Fib retracement level of the downward move from the 0.9954 swing high to 0.9852 low. An immediate resistance is near the 0.9900 level and the 50 hourly simple moving average.

There is also a major bearish trend line forming with resistance near 0.9905 on the hourly chart of EUR/USD. It is near the 50% Fib retracement level of the downward move from the 0.9954 swing high to 0.9852 low.

The next major resistance is near the 0.9920 level. A clear move above the 0.9920 resistance zone could set the pace for a larger increase towards 1.0000. The next major resistance is near the 1.0050 zone.

On the downside, an immediate support is near the 0.9865 level. The next major support is near the 0.9850 level. A downside break below the 0.9850 support could start another decline.

Disclaimer: CFDs are complex instruments and come with a high risk of losing your money.
I trade at FXOpen

Please add www.kreslik.com to your ad blocker white list.
Thank you for your support.


Return to “forex”