Daily analysis from FXOpen

forex live trades, setups, charts

Moderator: moderators

User avatar
whiteking
rank: 150+ posts
rank: 150+ posts
Posts: 350
Joined: Fri Aug 11, 2017 2:25 am
Reputation: 32
Gender: None specified

Re: Daily analysis from FXOpen

Postby whiteking » Fri Feb 09, 2024 2:27 pm

USD/JPY Reaches 10-week High amid Statements by Head of Bank of Japan
Image

Bank of Japan Governor Kazuo Ueda said today that there is a high likelihood that accommodative monetary conditions will continue even after the bank ends its negative interest rate policy — an event that is expected as early as next month, according to Reuters.

On the other hand, the USD index has been strengthening since the beginning of 2024, indicating that market participants assume that the easing of the current tight Fed policy may last longer.

As a result, the price of USD/JPY rises again towards the psychological level of 150 yen per dollar.

Image

The weekly USD/JPY chart shows that:
→ After an attempt at a bullish breakout of this level in the fall of 2022, a strong bearish impulse occurred (justified by the actions of the Bank of Japan to protect the yen), and the price dropped below the level of 130 yen per dollar in early 2023.
→ After an attempt at a bullish breakout in the fall of 2023, a less powerful bearish movement formed, the rate did not fall below 140 yen per dollar.

As a result, a huge cup-and-handle pattern has formed on the USD/JPY chart, which suggests that another attempt at a bullish breakout of the 150 yen per dollar level (if it happens) may be successful, and then the price will have room to continue to rise within the long-term ascending channel (shown in blue).

Technical analysis of the USD/JPY price on lower time frames will provide more details, updated in real time, about how active the bulls are in their push towards the 150 yen level, and how effectively the bears are resisting.

This article represents the opinion of the Companies operating under the FXOpen brand only. It is not to be construed as an offer, solicitation, or recommendation with respect to products and services provided by the Companies operating under the FXOpen brand, nor is it to be considered financial advice.
I trade at FXOpen

Please add www.kreslik.com to your ad blocker white list.
Thank you for your support.

User avatar
whiteking
rank: 150+ posts
rank: 150+ posts
Posts: 350
Joined: Fri Aug 11, 2017 2:25 am
Reputation: 32
Gender: None specified

Re: Daily analysis from FXOpen

Postby whiteking » Tue Feb 13, 2024 1:50 pm

Bitcoin Price Exceeds Psychological Level of $50k
Image

The last time the BTC price was above $50,000 was in December 2021, making its way to the low around $15,500 reached in November 2022.

Reaching the $50,000 level was facilitated by:
→ waiting for the halving, after which the price of Bitcoin is believed to receive a bullish impulse due to a reduction in supply;
→ the effect of the approval of a Bitcoin ETF;
→ expectation of easing of the Fed's monetary policy, which increases interest in risky assets. By the way, the Nasdaq-100 technology stock index set a historical high yesterday, breaking the level of 18,000 points.

Image

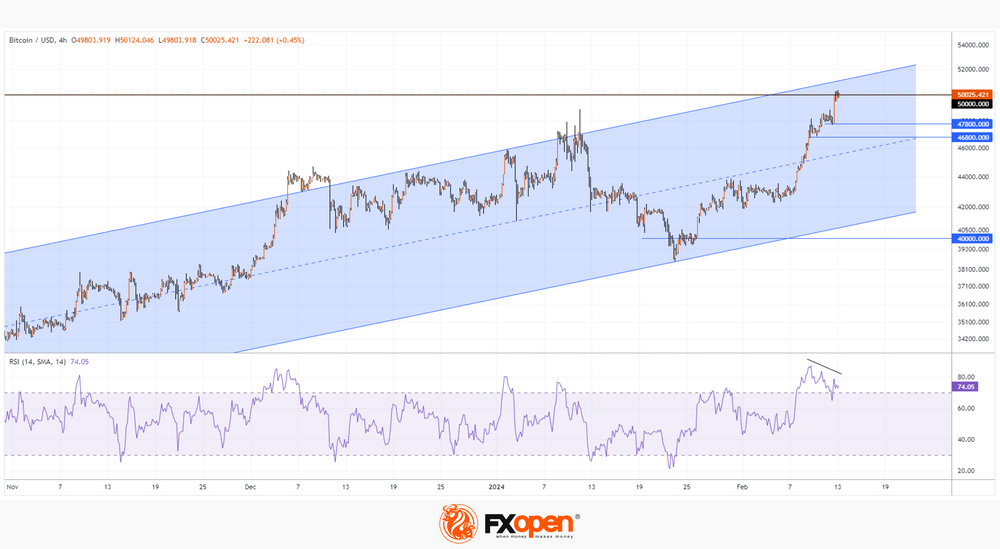
At the same time, the BTC/USD chart shows that:
→ the price of Bitcoin moves within an ascending channel (shown in blue), which dates back to last fall;
→ from the point of view of technical analysis, with this channel construction, the price of Bitcoin still has some room to rise to its upper limit.

However, please note that:
→ the widely known crypto fear and greed index has a value of 79 out of 100, indicating extreme greed;
→ the RSI indicator is in the overbought zone and is forming a bearish divergence pattern, which is a sign of weakening buying pressure;
→ exceeding the psychological level can result in a false breakout, as was the case with a short-term decline in the price of Bitcoin below the support level of 40,000.

Considering the above arguments, there is reason to believe that if the Bitcoin rally continues, it may soon be replaced by a correction to allow the market to “blow off steam” at least in the short term.

FXOpen offers the world's most popular cryptocurrency CFDs*, including Bitcoin and Ethereum. Floating spreads, 1:2 leverage — at your service. Open your trading account now or learn more about crypto CFD trading with FXOpen.

*At FXOpen UK and FXOpen AU, Cryptocurrency CFDs are only available for trading by those clients categorized as Professional clients under FCA Rules and Professional clients under ASIC Rules respectively. They are not available for trading by Retail clients.

This article represents the opinion of the Companies operating under the FXOpen brand only. It is not to be construed as an offer, solicitation, or recommendation with respect to products and services provided by the Companies operating under the FXOpen brand, nor is it to be considered financial advice.

I trade at FXOpen

User avatar
whiteking
rank: 150+ posts
rank: 150+ posts
Posts: 350
Joined: Fri Aug 11, 2017 2:25 am
Reputation: 32
Gender: None specified

Re: Daily analysis from FXOpen

Postby whiteking » Thu Feb 15, 2024 2:33 pm

Ethereum Price Exceeds $2,800
Image

The last time the ETH/USD price was at this level was in May 2022, which was the start of a massive drop of more than 65% in 1.5 months.

However, now the ETH/USD market is dominated by bullish sentiment, for the following reasons:

→ deployment of the Dencun update on the Ethereum network this month, which will open up new opportunities for users and developers;
→ expectations that this year, following the approval of Bitcoin ETFs, applications for the launch of ETFs on Ethereum will be approved;
→ waiting for a traditional bull market after halving in the Bitcoin network.

Image

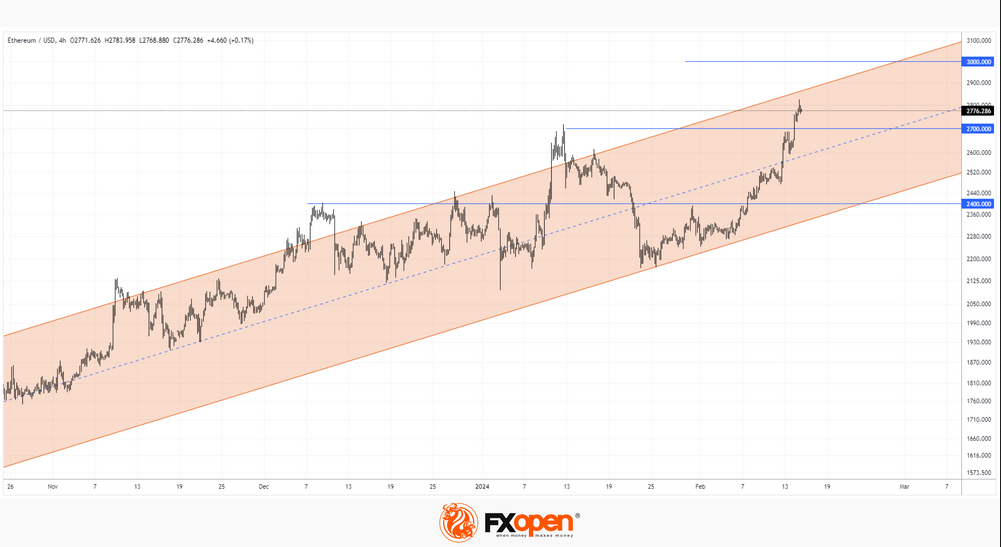
So far, the ETH/USD chart shows that the price of Ethereum is moving within an ascending channel that begins in 2023. Moreover, the price is in its upper half — an indication of the strength of demand. If the trend continues, the price of Ethereum could reach $3,000 within a month.

At the same time, the price of Ethereum is approaching the upper border of the channel, which may provide resistance. It is possible that the indicators will indicate that the market is overbought, creating the preconditions for the formation of a correction.

Probable support levels can help the bulls in a scenario where a correction develops:
→ 2,400: this level influenced the price of ETH starting in December 2023;
→ 2,700: former 2024 high, which was broken on a wide bullish candle (a sign of strong demand);
→ median line and lower boundary of the current channel.

FXOpen offers the world's most popular cryptocurrency CFDs*, including Bitcoin and Ethereum. Floating spreads, 1:2 leverage — at your service. Open your trading account now or learn more about crypto CFD trading with FXOpen.

*At FXOpen UK and FXOpen AU, Cryptocurrency CFDs are only available for trading by those clients categorized as Professional clients under FCA Rules and Professional clients under ASIC Rules respectively. They are not available for trading by Retail clients.

This article represents the opinion of the Companies operating under the FXOpen brand only. It is not to be construed as an offer, solicitation, or recommendation with respect to products and services provided by the Companies operating under the FXOpen brand, nor is it to be considered financial advice.
I trade at FXOpen

User avatar
whiteking
rank: 150+ posts
rank: 150+ posts
Posts: 350
Joined: Fri Aug 11, 2017 2:25 am
Reputation: 32
Gender: None specified

Re: Daily analysis from FXOpen

Postby whiteking » Fri Feb 16, 2024 1:46 pm

TSLA Share Price Rises Sharply amid News of Musk's Increased Stake in the Company
Image

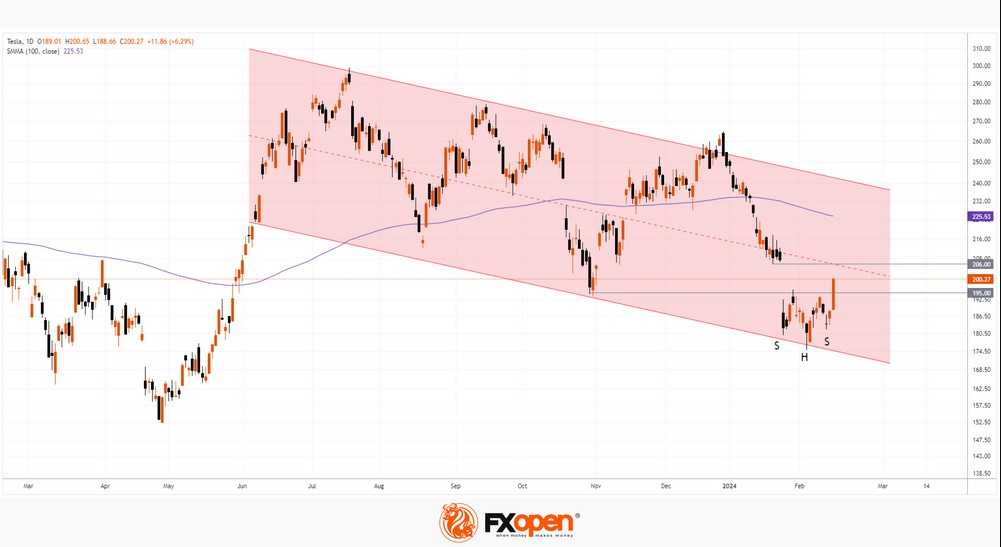
According to media reports, Elon Musk has increased his stake in Tesla by more than one and a half times — previously, the billionaire owned approximately 13% of the shares, now he owns 20.5% of Tesla. And earlier it was reported that Musk wants to increase his stake in Tesla to at least 25%.

At the same time, the TSLA share price rose sharply in yesterday's trading by more than 6%, while the S&P 500 stock market index increased by “only” +0.6%.

Image

The TSLA stock chart today shows that:
→ the price has overcome the psychological mark of USD 200 per share;
→ the price has overcome the resistance level of USD 195 per share;
→ a bullish reversal pattern inverted head-and-shoulders has formed on the chart.

The situation gives hope to the bulls in a disadvantageous situation, because:
→ TSLA stock price is in a bearish trend (as shown by the red channel);
→ the last quarter report disappointed investors — and the price formed a wide bearish gap at the end of January.

How determined are the bulls, will they be able to break the trend? This will show their ability to overcome resistance levels:
→ 206.0 – in the area of the upper border of the gap;
→ median line of the descending channel;
→ SMA line (100) pointing down.

This article represents the opinion of the Companies operating under the FXOpen brand only. It is not to be construed as an offer, solicitation, or recommendation with respect to products and services provided by the Companies operating under the FXOpen brand, nor is it to be considered financial advice.
I trade at FXOpen

User avatar
whiteking
rank: 150+ posts
rank: 150+ posts
Posts: 350
Joined: Fri Aug 11, 2017 2:25 am
Reputation: 32
Gender: None specified

Re: Daily analysis from FXOpen

Postby whiteking » Tue Feb 20, 2024 12:57 pm

Will investors focus on commodities in the advent of tomorrow's FOMC Minutes?
Image

Just over a day remains before the Federal Open Market Committee (FOMC) in the United States is set to release the minutes from its policy meeting, which was held at the end of January.

Ordinarily, announcements such as this are considered to be very important events in the global economic calendar, especially given that monetary policy, which the FOMC is responsible for administering, has been a very significant feature during these prolonged times of high-interest rates and stringent rulings by central banks across Western markets which have continued despite the high levels of inflation which ran into double figures being long since a thing of the past.

Perhaps the forthcoming publication of the minutes from the FOMC meeting, which took place on the final days of January, will not reveal any particular new matters of interest, largely because it is already widely understood that the US authorities will not be reducing interest rates in the foreseeable future, contrary to the understanding of many analysts and investors at the beginning of this year.

Given that Federal Reserve chairman Jerome Powell underscored the decision in a message at the beginning of February by saying that the Federal Reserve will not cut rates until it is certain that inflation is nearing the 2% target, it appears that any such minutes from a more recent meeting are not likely to affect the market that much.

In times during which the market expects a favourable approach by central bankers which will accelerate the economy, such as rate cuts which were anticipated for March and June this year, which do not materialise, it is often the case that attention turns to commodities.

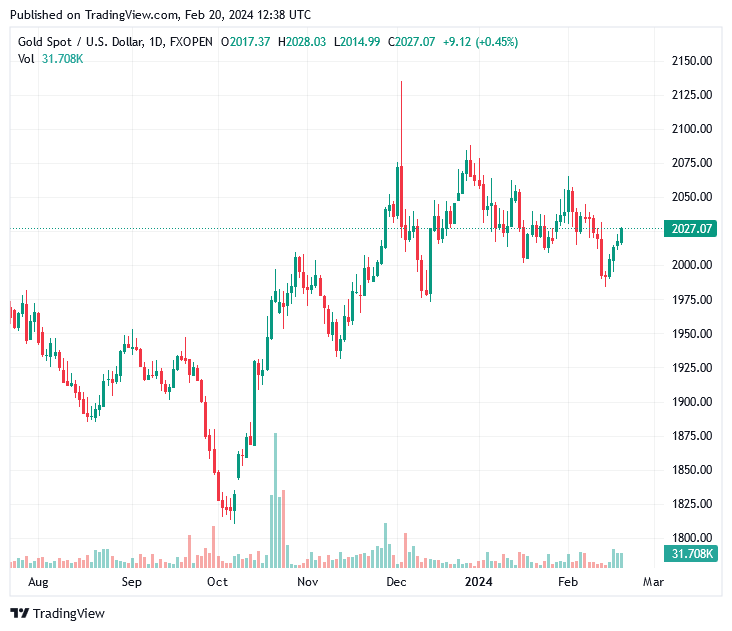
Over the past few days, spot gold has been increasing in value.

On February 13, spot gold was at its lowest value this year, trading at $1,990.69 per troy ounce at the bottom end of the candlestick, according to FXOpen pricing. This low point reversed, and spot gold has made a remarkable return over the past week, entering the market this morning across European time zones at just over $2,021 per troy ounce.

Image

When considering that gold is regarded as a de facto store of value during periods of economic change or policy uncertainty, the precious metal is now at a crossroads. The rally over the past week runs up to the perhaps predictable relaying of minutes from the aforementioned FOMC meeting, however, despite the FOMC having stuck firmly to its plan of not reducing rates despite huge speculation that it would reduce rates, market speculation has begun once again with confidence beginning to be demonstrated that the Federal Reserve may cut rates in June.

This is pure speculation from across the market, however, and absolutely no indication by the central bank to this effect has been given. Therefore, bets on a rate cut that could take place in June rather than the previous speculations of March tend to support the US dollar at the expense of the non-yielding gold price.

Whilst the market makes such predictions, the authorities remain tight-lipped, and gold continues to be strong in value, perhaps as a consequence of this juxtaposition.

This article represents the opinion of the Companies operating under the FXOpen brand only. It is not to be construed as an offer, solicitation, or recommendation with respect to products and services provided by the Companies operating under the FXOpen brand, nor is it to be considered financial advice.
I trade at FXOpen

Please add www.kreslik.com to your ad blocker white list.
Thank you for your support.

User avatar
whiteking
rank: 150+ posts
rank: 150+ posts
Posts: 350
Joined: Fri Aug 11, 2017 2:25 am
Reputation: 32
Gender: None specified

Re: Daily analysis from FXOpen

Postby whiteking » Wed Feb 21, 2024 2:36 pm

NASDAQ Price Declining Ahead of NVDA Report
Image

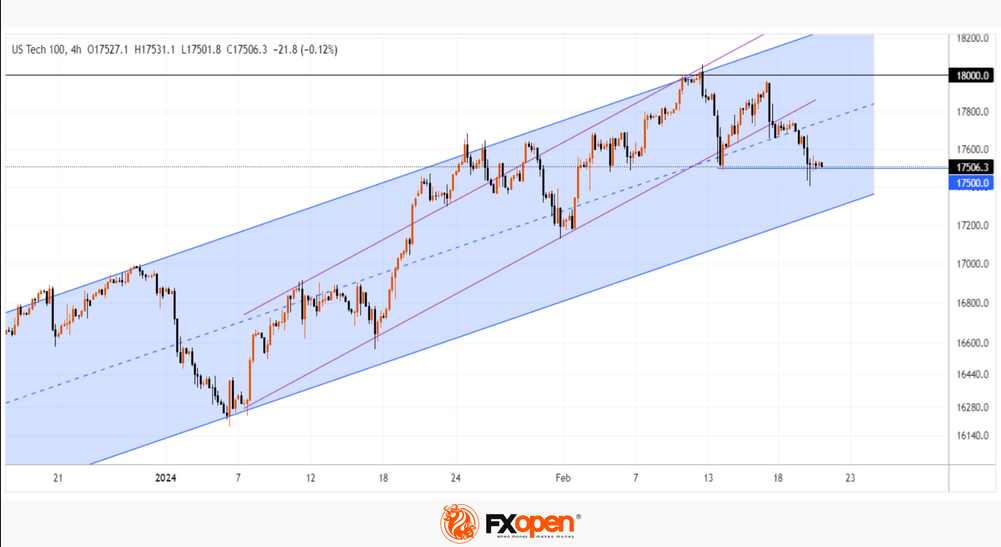
E-mini NASDAQ 100 futures fell below the psychological 17,500 level yesterday after trading above 18,000 on Friday.

The reason for the decline may be the fears of market participants ahead of the news release:
→ today after the close of the main trading session, Nvidia, the 5th largest company by capitalization, will publish its report;
→ today at 22:00 GMT+3, data from the Federal Reserve will be published, which will provide important information about the prospects for lowering the interest rate.

However, for now the decline looks like a correction.

Image

The NASDAQ 100 chart shows that:
→ the price is within an uptrend (shown by a blue channel);
→ the level of 18000 acted as psychological resistance, as the price turned down after a small puncture;
→ the price fixes below the local ascending channel (shown by purple lines).

For now, the support level at 17,500 is keeping the price from falling further, but if the news is disappointing, the price may drop to the lower border of the channel — it is even possible that the bears will attempt a breakout.

This article represents the opinion of the Companies operating under the FXOpen brand only. It is not to be construed as an offer, solicitation, or recommendation with respect to products and services provided by the Companies operating under the FXOpen brand, nor is it to be considered financial advice.
I trade at FXOpen

User avatar
whiteking
rank: 150+ posts
rank: 150+ posts
Posts: 350
Joined: Fri Aug 11, 2017 2:25 am
Reputation: 32
Gender: None specified

Re: Daily analysis from FXOpen

Postby whiteking » Thu Feb 22, 2024 12:55 pm

NVDA Share Price Soars 11% after Report
Image

The signs of concern we wrote about yesterday have largely subsided. After three days of declines, the price of E-mini Nasdaq 100 futures bounced off the lower boundary of the channel (see yesterday's chart) and rose, led by NVDA stock.

Nvidia's quarterly report exceeded expectations:
→ earnings per share: actual = USD 5.16, expected = USD 4.59;
→ gross revenue: actual = USD 22.10 billion, expected = USD 20.39 billion.

According to the head of the company:
→ Accelerated computing and generative AI have reached a tipping point.
→ Demand for computing is growing worldwide among companies, industries and governments.
→ The coming year will bring major new product cycles with exceptional innovations that will help propel the industry forward.

In post-market trading, NVDA's price rose 11% to over USD 740 per share. Thus, the price increase for NVDA since the beginning of 2024 is about 50%.

Image

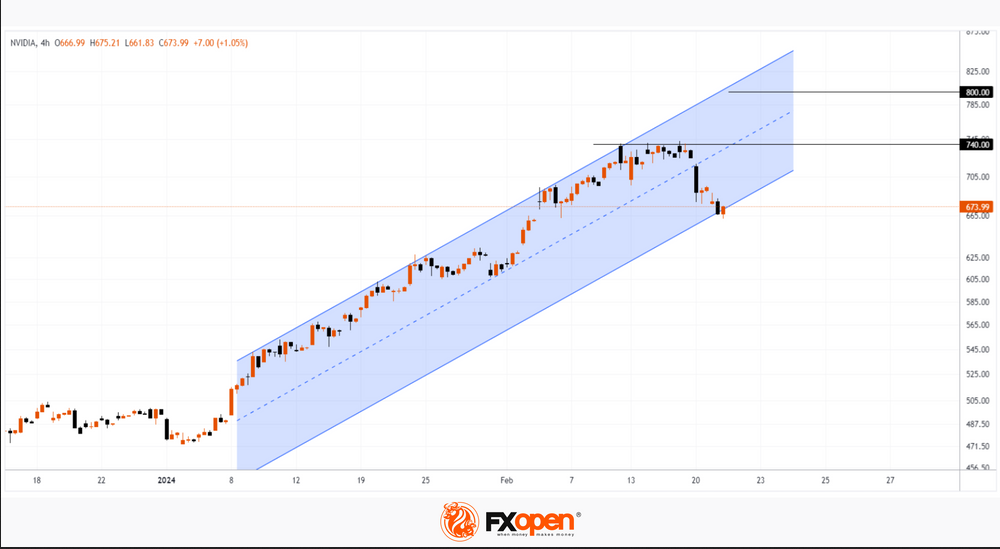
The NVDA stock chart shows that:
→ the USD 740 level acted as resistance in February;
→ however, taking into account the post-market price, we can assume that today at the opening of trading this resistance level will be broken and in the future, according to the logic of technical analysis, will begin to provide support;
→ in this case, a rebound will be formed from the lower line of the channel (shown in blue) and a wide bullish gap.

It's likely that the excitement surrounding Nvidia's strong report will continue. But the closer the price of NVDA rises to the upper border of the channel (which is located around the psychological level of USD 800), the more signs of overbought there will be on the indicators — therefore, the preconditions will be created for a correction after the extraordinary growth.

This article represents the opinion of the Companies operating under the FXOpen brand only. It is not to be construed as an offer, solicitation, or recommendation with respect to products and services provided by the Companies operating under the FXOpen brand, nor is it to be considered financial advice.
I trade at FXOpen

User avatar
whiteking
rank: 150+ posts
rank: 150+ posts
Posts: 350
Joined: Fri Aug 11, 2017 2:25 am
Reputation: 32
Gender: None specified

Re: Daily analysis from FXOpen

Postby whiteking » Thu Feb 22, 2024 12:56 pm

NVDA Share Price Soars 11% after Report
Image

The signs of concern we wrote about yesterday have largely subsided. After three days of declines, the price of E-mini Nasdaq 100 futures bounced off the lower boundary of the channel (see yesterday's chart) and rose, led by NVDA stock.

Nvidia's quarterly report exceeded expectations:
→ earnings per share: actual = USD 5.16, expected = USD 4.59;
→ gross revenue: actual = USD 22.10 billion, expected = USD 20.39 billion.

According to the head of the company:
→ Accelerated computing and generative AI have reached a tipping point.
→ Demand for computing is growing worldwide among companies, industries and governments.
→ The coming year will bring major new product cycles with exceptional innovations that will help propel the industry forward.

In post-market trading, NVDA's price rose 11% to over USD 740 per share. Thus, the price increase for NVDA since the beginning of 2024 is about 50%.

Image

The NVDA stock chart shows that:
→ the USD 740 level acted as resistance in February;
→ however, taking into account the post-market price, we can assume that today at the opening of trading this resistance level will be broken and in the future, according to the logic of technical analysis, will begin to provide support;
→ in this case, a rebound will be formed from the lower line of the channel (shown in blue) and a wide bullish gap.

It's likely that the excitement surrounding Nvidia's strong report will continue. But the closer the price of NVDA rises to the upper border of the channel (which is located around the psychological level of USD 800), the more signs of overbought there will be on the indicators — therefore, the preconditions will be created for a correction after the extraordinary growth.

This article represents the opinion of the Companies operating under the FXOpen brand only. It is not to be construed as an offer, solicitation, or recommendation with respect to products and services provided by the Companies operating under the FXOpen brand, nor is it to be considered financial advice.
I trade at FXOpen

User avatar
whiteking
rank: 150+ posts
rank: 150+ posts
Posts: 350
Joined: Fri Aug 11, 2017 2:25 am
Reputation: 32
Gender: None specified

Re: Daily analysis from FXOpen

Postby whiteking » Fri Feb 23, 2024 1:23 pm

Nvidia's Successes Helps S&P 500 Price Reach Its All-time High
Image

Yesterday, the price of the S&P 500 stock index rose to record closing highs on Thursday. Moreover, such a growth rate (+2.11% per day) has not been observed for 13 months.

Reasons for Extremely Bullish Sentiment:
→ Nvidia's report, which showed impressive earnings and prospects (the company forecasts roughly threefold revenue growth in the first quarter of 2024 amid strong demand for its AI chips). Nvidia's capitalization grew by USD 277 billion in one day — a historical record for the US stock market.
→ Positive news background for yesterday: the US Flash Manufacturing PMI index was actually = 51.5, expected = 50.5, a month ago = 50.7. Signals from the labor market were also positive - the weekly number of applications for unemployment benefits turned out to be = 201k (expected = 217k).
Image

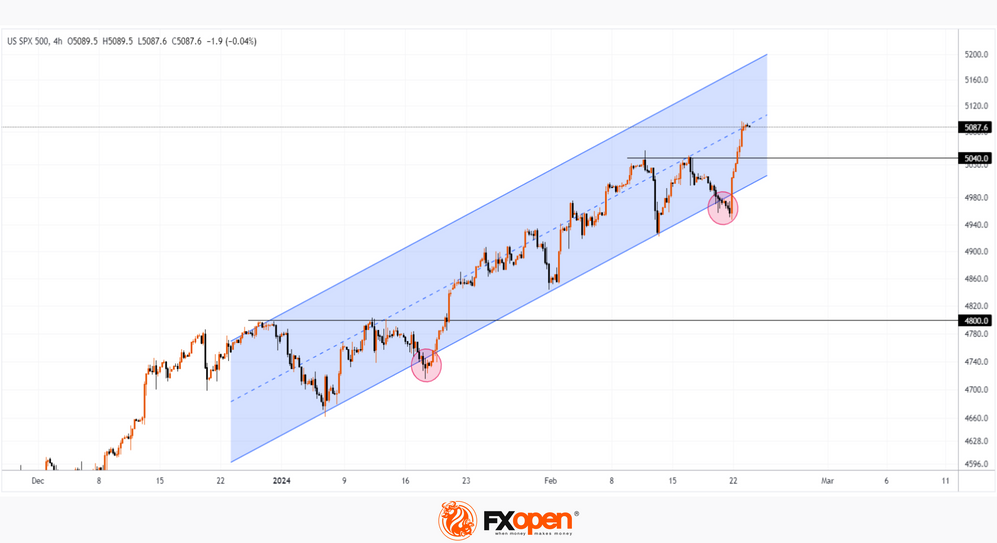
Technical analysis of the S&P 500 chart shows that the price continues to move within the ascending channel, which has been in effect since the beginning of 2024 (shown in blue).

Interestingly, the price of the S&P 500 made a small breakdown of the lower boundary on February 21; a similar pattern was observed on January 17 (both patterns are circled in red). In both cases:
→ after a false breakout of the lower border, a decisive breakout of the resistance level followed: in January this was the level of 4,800, yesterday, the level of 5,040 was broken.
→ The price showed signs of consolidation having reached the median line of the channel.

If the price of the S&P 500 continues to act according to the same scenario, we may see the formation of price consolidation above the broken level of 5,040 and its gradual increase along the median.

This article represents the opinion of the Companies operating under the FXOpen brand only. It is not to be construed as an offer, solicitation, or recommendation with respect to products and services provided by the Companies operating under the FXOpen brand, nor is it to be considered financial advice.
I trade at FXOpen

User avatar
whiteking
rank: 150+ posts
rank: 150+ posts
Posts: 350
Joined: Fri Aug 11, 2017 2:25 am
Reputation: 32
Gender: None specified

Re: Daily analysis from FXOpen

Postby whiteking » Mon Feb 26, 2024 1:48 pm

Bitcoin Price Risks Not Staying above $50k
Image
On February 14, a strong bullish impulse was recorded in the BTC/USD market, which pushed the price of bitcoin to the area above USD 50k.

The main driver of growth was the effect of the launch of a bitcoin ETF. More than a month has passed since this event, and according to media reports, the ETF has seen an influx of more than USD 7 billion. For example, BlackRock has about 125k bitcoins on its balance sheet to support its ETF fund.

Also adding to the positive mood among market participants is news about the benefits received by companies that invested in bitcoin: MicroStrategy, Block and others. Among the latest news is Reddit's decision to invest in bitcoin.

Image

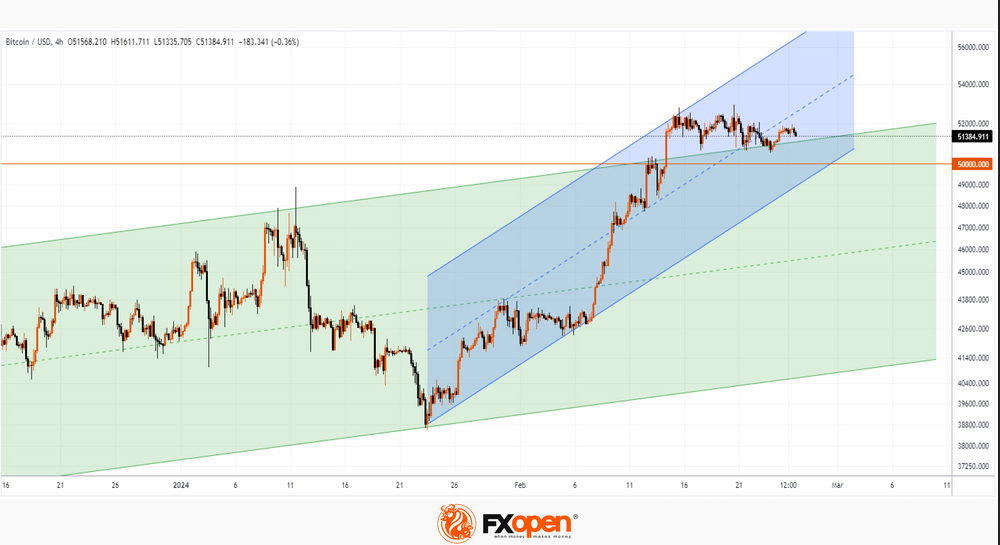
However, technical analysis of the BTC/USD chart shows alarming signs:
→ bitcoin price has slightly exceeded the upper limit of the larger ascending channel (shown in green), but how does it behave in tests? The upper border has changed its role from resistance to support (according to the classic technical analysis pattern), but rebounds from this support line quickly lose momentum. The price does not seem to have the energy (force of demand) to rise from the existing support level.
→ Bitcoin price dropped to the lower border of a smaller ascending channel (shown in blue) - a sign that the February positive is running out.

Given the signs of weakening demand, it is possible that we will see an attempt by the bears to take the initiative and return the price of bitcoin below the psychological level of 50k per coin.

*At FXOpen UK and FXOpen AU, Cryptocurrency CFDs are only available for trading by those clients categorized as Professional clients under FCA Rules and Professional clients under ASIC Rules respectively. They are not available for trading by Retail clients.

This article represents the opinion of the Companies operating under the FXOpen brand only. It is not to be construed as an offer, solicitation, or recommendation with respect to products and services provided by the Companies operating under the FXOpen brand, nor is it to be considered financial advice.
I trade at FXOpen

Please add www.kreslik.com to your ad blocker white list.
Thank you for your support.


Return to “forex”