Daily analysis from FXOpen

forex live trades, setups, charts

Moderator: moderators

User avatar
whiteking
rank: 150+ posts
rank: 150+ posts
Posts: 350
Joined: Fri Aug 11, 2017 2:25 am
Reputation: 32
Gender: None specified

Re: Daily analysis from FXOpen

Postby whiteking » Tue Jan 09, 2024 2:04 pm

The Swiss National Bank Suffered Losses of 3 Billion Francs in 2023
Image

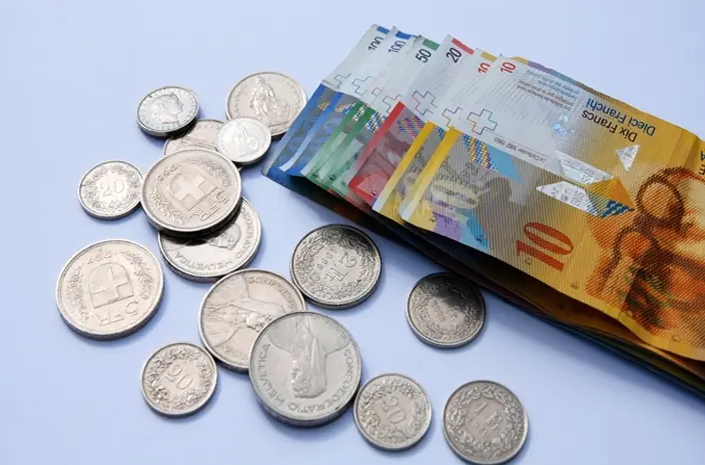
The Swiss National Bank (SNB) reported an annual loss of 3 billion Swiss francs (USD 3.54 billion) in 2023 and said it would not make payments to Switzerland's central or local government or pay dividends to investors.

The loss is believed to have occurred as a result of interest rate hikes aimed at fighting inflation.

Although in Switzerland, perhaps, inflation is at the lowest level: according to yesterday's Core Price Index data, the actual value is = 0.0% (expected = 0.1%, a year ago = -0.2%, the highest actual value in 2023 was = +0.7 %). However, the SNB raised the rate to 1.75% twice in 2023, and this led to it making more payments to deposit account holders.

Note that the loss for 2023 is much less than the record minus 133 billion for 2022. Reuters writes that the losses will not affect the bank's current monetary policy, and interest rates could be cut during 2024.

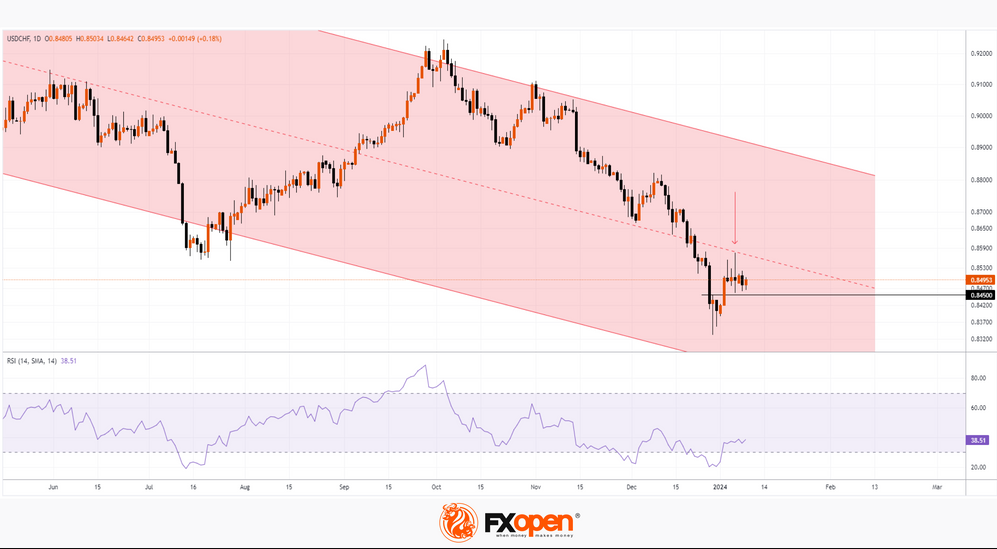
On November 2, we wrote that the franc could continue to strengthen. Since then, USD/CHF has fallen about 6%, setting its 2023 low on December 28 at 0.83327.
Image

The graph shows that:

  • -> during 2023, the price moved within the descending channel;
  • -> at the 2023 low, the price was unable to reach its lower limit - a sign of a lack of selling pressure;
  • -> the median line of the channel still serves as resistance (as shown by the arrow);
  • -> level 0.845 changed its role from resistance to support;
  • -> in the area of the 2023 lows, long lower shadows were formed on the candles (a sign of aggressive demand). At the same time, the RSI indicator showed that the market was strongly oversold.

Taking into account the above arguments, it can be assumed that the USD will be able to strengthen against the franc, stopping the pace of the downward trend in 2023. A bullish breakdown of the median line (or failure of the price to consolidate below the 0.845 level) will provide more arguments in favor of the presence of demand in the market in question.


This article represents the opinion of the Companies operating under the FXOpen brand only. It is not to be construed as an offer, solicitation, or recommendation with respect to products and services provided by the Companies operating under the FXOpen brand, nor is it to be considered financial advice.
I trade at FXOpen

Please add www.kreslik.com to your ad blocker white list.
Thank you for your support.

User avatar
whiteking
rank: 150+ posts
rank: 150+ posts
Posts: 350
Joined: Fri Aug 11, 2017 2:25 am
Reputation: 32
Gender: None specified

Re: Daily analysis from FXOpen

Postby whiteking » Wed Jan 10, 2024 12:36 pm

Inflation in Australia Continues To Decline. AUD/USD Tests Important Support
Image

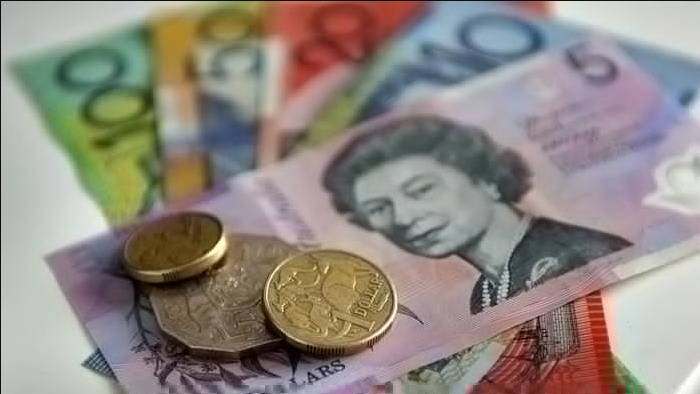
Data today from the Australian Bureau of Statistics on Wednesday showed the monthly consumer price index (CPI) rose 4.3% year-on-year in November, the slowest pace since January 2022. Value a month earlier = 4.9%. Market forecasts = 4.4%.

This strengthened market expectations that interest rates would not have to rise further. Although the head of the Reserve Bank of Australia, Michele Bullock, warned of the risks of rising price pressures caused by domestic demand, for example, due to rising prices for rental housing.

Against the backdrop of the publication of news about inflation in Australia, no strong surges were noticed in the AUD/USD market. Perhaps this was due to the fact that there were no surprises.

Image

Meanwhile, the 4-hour chart shows that the AUD/USD rate is nearing important support, which is formed by the lower line of the trend channel (shown in blue), within which the price has been moving since last fall.

Wherein:

  • -> in 2024, the price managed to push off from this line several times, but continued growth did not follow;
  • -> the highs of the days of January 4, 5 and 9 form a sequence of falling tops;
  • -> on January 5, prices broke through the low of December 15, but then rose sharply - a sign of demand below the level of 0.667.
Thus, the chart provides evidence to suggest that the forces of demand have enough capacity to prevent the price from falling, but are so exhausted that they cannot resume the upward trend in the blue channel.

It is possible that the AUD/USD market will trade in a restrained manner until the release of tomorrow's inflation news in the US (16:30 GMT+3), which could lead to the formation of a new balance of supply and demand.


This article represents the opinion of the Companies operating under the FXOpen brand only. It is not to be construed as an offer, solicitation, or recommendation with respect to products and services provided by the Companies operating under the FXOpen brand, nor is it to be considered financial advice.
I trade at FXOpen

User avatar
whiteking
rank: 150+ posts
rank: 150+ posts
Posts: 350
Joined: Fri Aug 11, 2017 2:25 am
Reputation: 32
Gender: None specified

Re: Daily analysis from FXOpen

Postby whiteking » Thu Jan 11, 2024 2:30 pm

Finally! The SEC Approves all 11 Applications for Bitcoin ETFs
Image

The following ETFs can start operating today:

  • Blackrock's iShares Bitcoin Trust (IBIT)
  • ARK 21Shares Bitcoin ETF (ARKB)
  • WisdomTree Bitcoin Fund (BTCW)
  • Invesco Galaxy Bitcoin ETF (BTCO)
  • Bitwise Bitcoin ETF (BITB)
  • VanEck Bitcoin Trust (HODL)
  • Franklin Bitcoin ETF (EZBC)
  • Fidelity Wise Origin Bitcoin Trust (FBTC)
  • Valkyrie Bitcoin Fund (BRRR)
  • Grayscale Bitcoin Trust (GBTC)
  • Hashdex Bitcoin ETF (DEFI)

Despite the regulatory approval of the first spot Bitcoin ETFs in US history, the head of the US Securities and Exchange Commission (SEC) Gary Gensler has not changed his critical attitude towards cryptocurrencies. Thus, the regulator sees signs of illegally issued securities in many cryptocurrencies that operate on the Proof-of-Stake (PoS) algorithm.

According to Gensler, the regulator was forced to approve the applications due to “changed circumstances.” This is likely a reference to the recent litigation where Grayscale filed a request with the Commission to transform its Bitcoin fund into a spot ETF. The judge then concluded that the regulator had wrongfully rejected the company's application.

Gensler also warned investors about the numerous risks associated with Bitcoin.

Meanwhile:

  • -> Funds whose applications have been approved are reducing fees one after another, trying to win the competition for investors.
  • -> Bank of England (BOE) Governor Andrew Bailey, speaking before the Treasury Committee of the United Kingdom Parliament, called Bitcoin ineffective.
  • -> Cryptocurrency exchange apps have become unavailable in India due to the introduction of stricter legislation governing cryptocurrencies.

Image

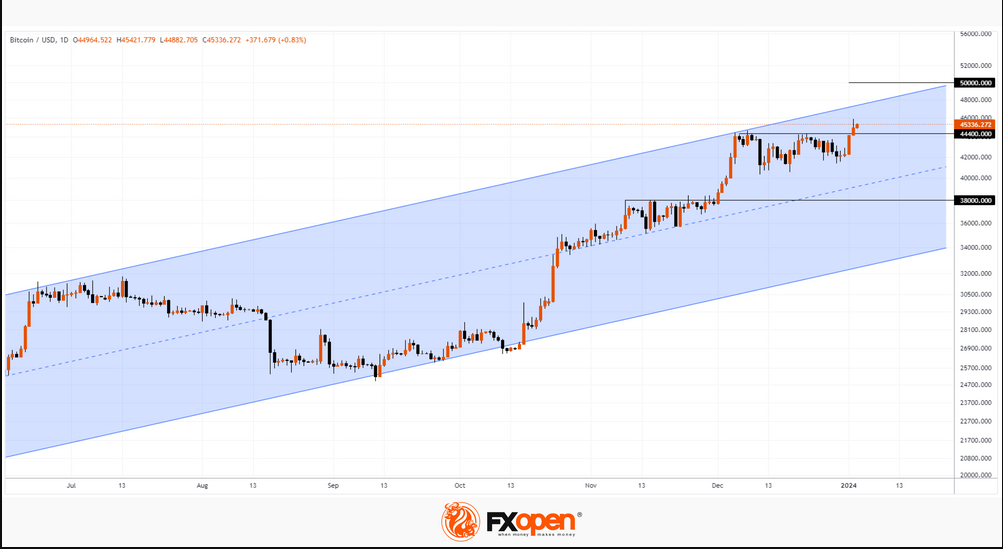
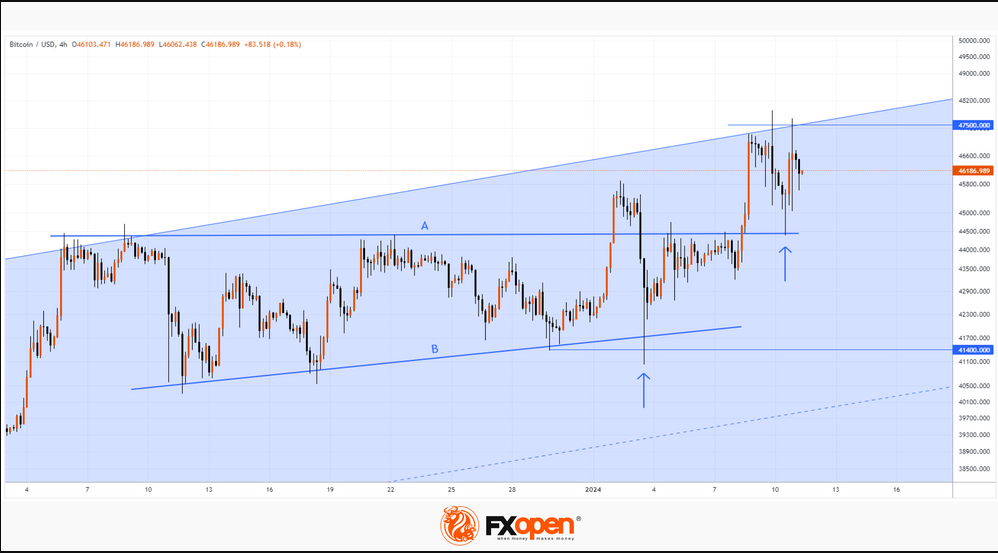
The chart shows that the price of BTC/USD did not change much after the official SEC decision. This highlights that the price of Bitcoin on exchanges has already taken into account the high probability of ETF approval.

We wrote earlier that Bitcoin is starting the year with bullish sentiment.

Note that:
  • -> The price of Bitcoin has reached the upper limit of the long-term channel (shown in blue, it is shown more fully in the post at the link above). Technically, resistance to growth should be expected from the upper border, which is, in principle, observed on the chart.
  • -> On January 2, the bulls tried to break through the A-B consolidation zone, but failed.
  • -> On January 3, there was an attempt at a bearish breakout (shown by an arrow), and it also turned out to be unsuccessful.
  • ->Recent price action shows that line A (44,400) is now acting as support.

Fundamentally, the price could be pushed higher by news that demand for new ETFs is exceeding expectations. But even if the price continues to rise on the new impulse, it will face the psychological mark of 50k per coin — it is possible that a false bullish breakout of the round figure will occur.


This article represents the opinion of the Companies operating under the FXOpen brand only. It is not to be construed as an offer, solicitation, or recommendation with respect to products and services provided by the Companies operating under the FXOpen brand, nor is it to be considered financial advice.
I trade at FXOpen

User avatar
whiteking
rank: 150+ posts
rank: 150+ posts
Posts: 350
Joined: Fri Aug 11, 2017 2:25 am
Reputation: 32
Gender: None specified

Re: Daily analysis from FXOpen

Postby whiteking » Fri Jan 12, 2024 1:41 pm

Market Analysis: AUD/USD and NZD/USD Eye Key Upside Break
Image

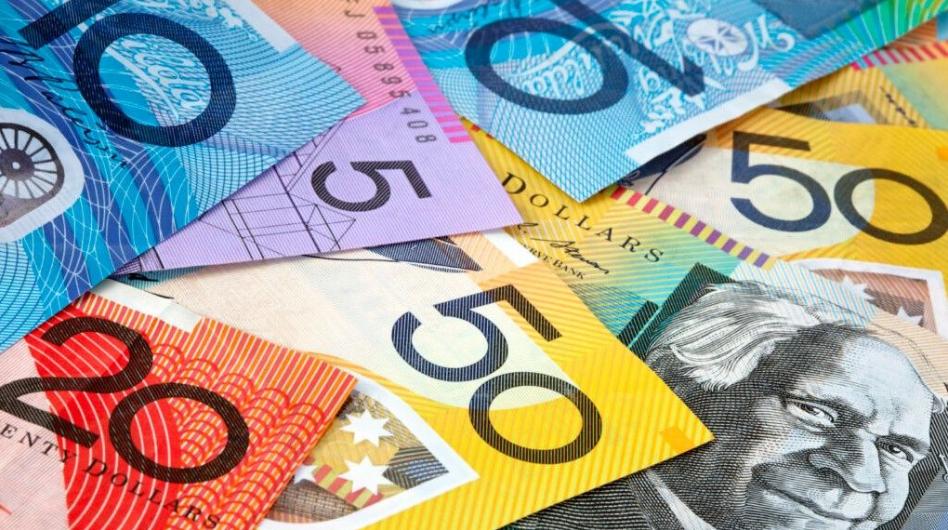
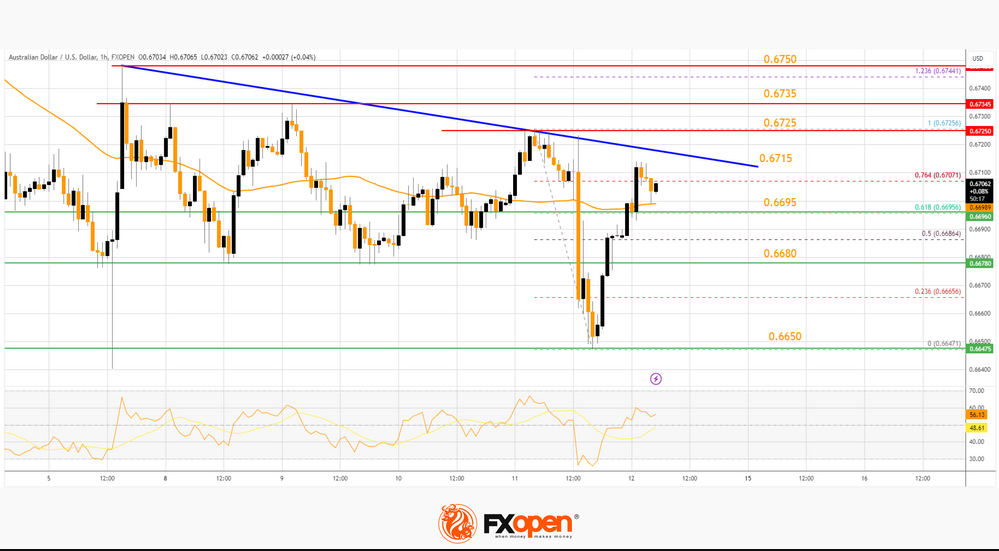
AUD/USD is moving higher and might rally if it clears 0.6725. NZD/USD is also rising and could extend its increase above the 0.6255 resistance zone.

Important Takeaways for AUD USD and NZD USD Analysis Today

  • The Aussie Dollar started a fresh increase above the 0.6680 and 0.6695 levels against the US Dollar.
  • There is a key bearish trend line forming with resistance near 0.6715 on the hourly chart of AUD/USD at FXOpen.
  • NZD/USD is showing positive signs above the 0.6220 support.
  • There is a major bearish trend line forming with resistance near 0.6255 on the hourly chart of NZD/USD at FXOpen.

AUD/USD Technical Analysis

On the hourly chart of AUD/USD at FXOpen, the pair started a fresh increase from the 0.6650 support. The Aussie Dollar was able to clear the 0.6680 resistance to move into a positive zone against the US Dollar.

The bulls pushed the pair above the 50% Fib retracement level of the downward move from the 0.6725 swing high to the 0.6647 low. There was a close above the 0.6695 resistance and the 50-hour simple moving average.

Image

Finally, the pair spiked above the 76.4% Fib retracement level of the downward move from the 0.6725 swing high to the 0.6647 low. On the upside, the AUD/USD chart indicates that the pair is now facing resistance near a key bearish trend line at 0.6715.

The first major resistance might be 0.6725. An upside break above the 0.6725 resistance might send the pair further higher. The next major resistance is near the 0.6750 level. Any more gains could clear the path for a move toward the 0.6820 resistance zone.

If not, the pair might correct lower below the 50-hour simple moving average at 0.6695. The next support could be 0.6680. If there is a downside break below the 0.6680 support, the pair could extend its decline toward the 0.6650 zone. Any more losses might signal a move toward 0.6600.

This article represents the opinion of the Companies operating under the FXOpen brand only. It is not to be construed as an offer, solicitation, or recommendation with respect to products and services provided by the Companies operating under the FXOpen brand, nor is it to be considered financial advice.
I trade at FXOpen

User avatar
whiteking
rank: 150+ posts
rank: 150+ posts
Posts: 350
Joined: Fri Aug 11, 2017 2:25 am
Reputation: 32
Gender: None specified

Re: Daily analysis from FXOpen

Postby whiteking » Mon Jan 15, 2024 1:01 pm

BTC/USD price and the “Three Black Crows” pattern
Image

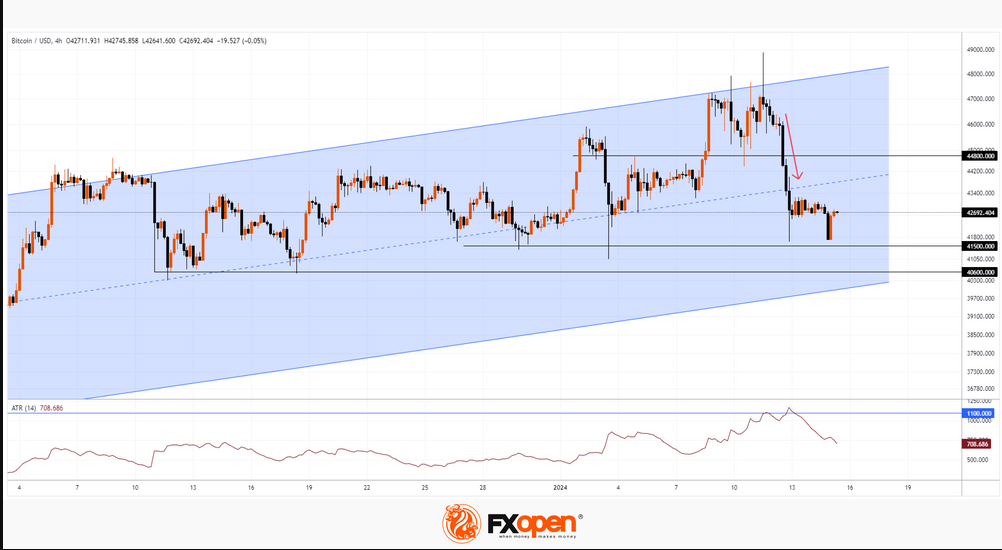
On January 11, the highly publicized Bitcoin ETF began trading after it was officially approved by the SEC. On this day, the price of Bitcoin exceeded USD 48,800, as shown by the chart. Bloomberg writes that new US spot funds achieved net inflows of USD 819 million in the first two days of trading.

However, from the high on January 11, a dizzying fall began, and already at the low on January 12, Bitcoin was worth less than USD 41,800. This dynamic may illustrate the “buy the rumors, sell the facts” strategy, which we wrote about on January 3 when predicting the price of Bitcoin in 2024.

News of the ETF's approval sent the ATR above 1,100 on the 4-hour chart, the last time it did so was in mid-June 2022. The market was overly active, and what is important is that three bearish candles (marked with an arrow) summed up this activity. They can be interpreted as the three black crows pattern.

According to statistics from Tim Bulkowski, this pattern works in 78% of cases and means a trend change from bullish to bearish. According to CandleScanner statistics for 20 years, collected on the S&P 500 index market, the pattern turned out to be false only in 18.6% of cases out of 543 occurrences.

Does this mean that the statistics will work on the Bitcoin price chart?

Image

So far, the price is still within the bullish trend (shown as a channel).

The nearest support levels: 41,500, 40,600, the lower border of the channel.

The nearest resistance levels: 44,800, the median line of the channel.

Let’s assume that the beginning of the week will show a continued influx of capital into the Bitcoin ETF. At the same time, it is possible that the price will form a rebound from one of the support lines. But what if these investors also fall into the trap that those who bought Bitcoin on January 11-12 are now in? Then we may witness a breakdown of the lower border of the blue channel, which will confirm the importance of the three black crows pattern.

This article represents the opinion of the Companies operating under the FXOpen brand only. It is not to be construed as an offer, solicitation, or recommendation with respect to products and services provided by the Companies operating under the FXOpen brand, nor is it to be considered financial advice.
I trade at FXOpen

Please add www.kreslik.com to your ad blocker white list.
Thank you for your support.

User avatar
whiteking
rank: 150+ posts
rank: 150+ posts
Posts: 350
Joined: Fri Aug 11, 2017 2:25 am
Reputation: 32
Gender: None specified

Re: Daily analysis from FXOpen

Postby whiteking » Tue Jan 16, 2024 1:05 pm

Microsoft Becomes the Most Expensive Company in the World, Surpassing Apple
Image

According to the results of trading shares of AAPL and MSFT yesterday, the market capitalization is:
  • -> Apple: USD 2.875 trillion.
  • -> Microsoft: USD 2.887 trillion.

This is facilitated by:
  • -> positive expectations of investors in shares of MSFT, connected with the leading positions of the company in the field of artificial intelligence;
  • -> negative sentiments regarding AAPL and demand for its products (as we wrote on January 4). Moreover, the New York Times writes that the Justice Department is preparing to initiate a large-scale antitrust case against Apple because of the dominant position of Apple's devices on the market and the measures that the company used to protect against threats to its business.

MarketWatch provides FactSet statistics on analysts' forecasts:
  • -> AAPL: +6% for the next 12 months, MSFT: +9%.
  • -> MSFT has such ratings: "buy": 90%, "neutral": 10%, "sell": 0%.
  • -> AAPL has such ratings: "buy": 57%, "neutral": 34%, "sell": 9%.


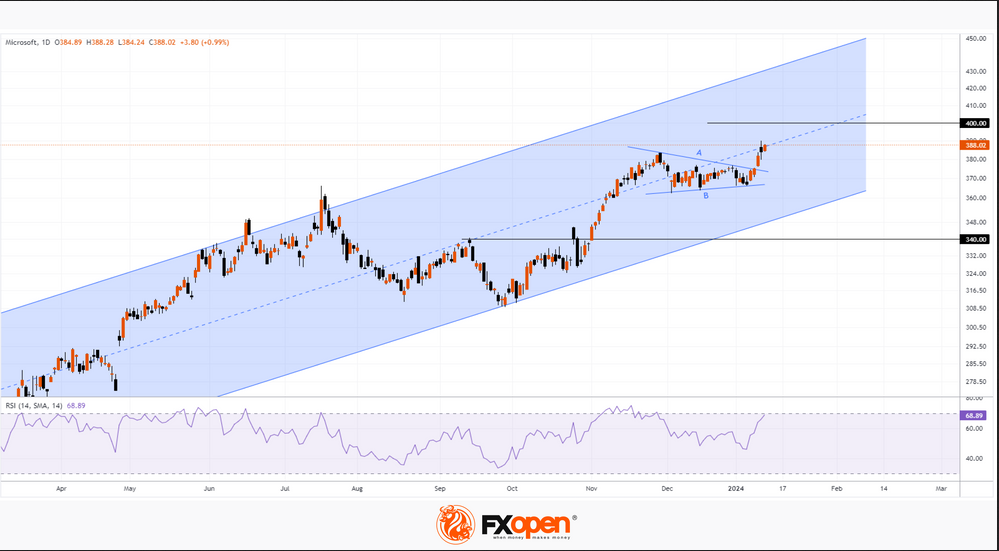
While the price of AAPL is below the maximum of 2023 by approximately 6%, the price of MSFT shares managed to renew the historical record in 2024: at the peak on January 11, MSFT gave more than 390 USD per share.

On January 31, data will be published on Microsoft’s Q4. It is not excluded that while waiting for positive figures, the price of the stock will increase, approaching the psychological level of 400 USD.

Image

The MSFT chart shows that:
  • -> The price is in an upward trend (shown by the blue channel), moving upwards;
  • -> The figure of consolidation А-В was broken by bulls, which demonstrates their intentions to set new historical records;
  • -> at the same time, the acceleration of the growth can make the stock overbought (the RSI indicator is near the level = 70).

This article represents the opinion of the Companies operating under the FXOpen brand only. It is not to be construed as an offer, solicitation, or recommendation with respect to products and services provided by the Companies operating under the FXOpen brand, nor is it to be considered financial advice.
I trade at FXOpen

User avatar
whiteking
rank: 150+ posts
rank: 150+ posts
Posts: 350
Joined: Fri Aug 11, 2017 2:25 am
Reputation: 32
Gender: None specified

Re: Daily analysis from FXOpen

Postby whiteking » Fri Jan 19, 2024 2:03 pm

NASDAQ 100 Reaches Historic High. META Shares May Surpass the Historical High
Image

The American stock index NASDAQ 100 has set a new historical high, surpassing the psychological mark of 17,000 points.

The growth was attributed to:

  • -> Analysts at Bank of America raising the rating of AAPL stocks, recommending them for BUY. The price of AAPL shares rose by almost 4%.
  • -> The growth of AMD and NVDA stock prices, as chip manufacturers are significant beneficiaries due to the widespread adoption of AI.
  • -> The earnings season gaining momentum. Market participants anticipate strong results from major technology companies (MSFT, GOOGL, NVDA, and others).

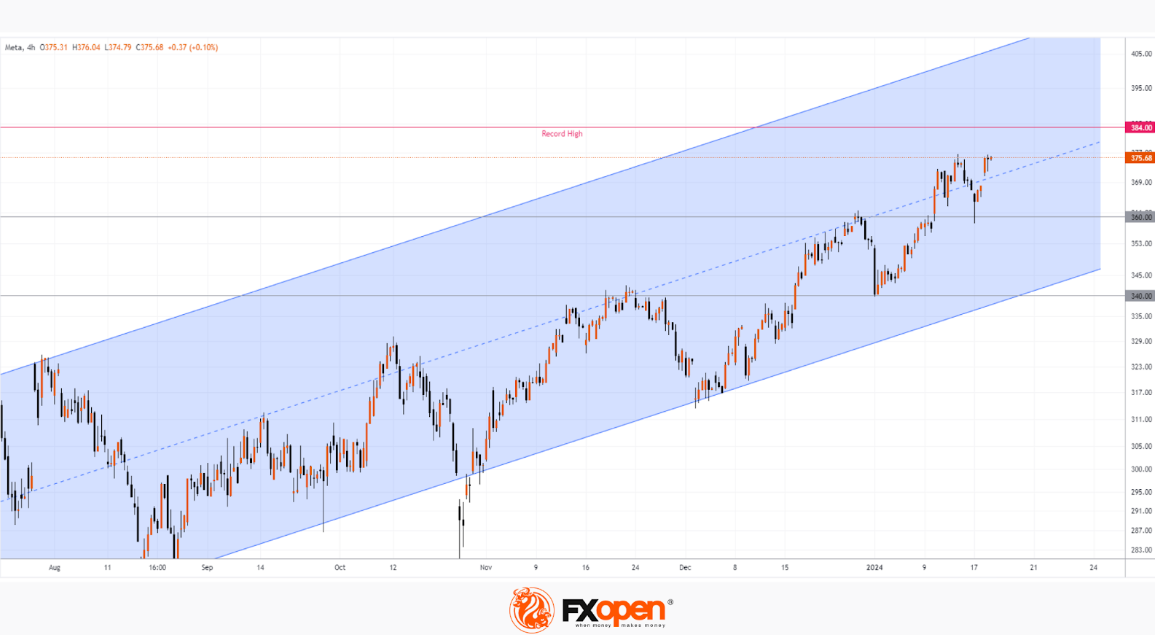
Note the movement of META stock price - the social media giant is close to reclaiming a $1 trillion market capitalisation.

Image

The META stock price chart shows that:
  • -> The market is in an upward trend (indicated by the blue channel). The price is above the median line, a sign of demand stability.
  • -> The level at $340 has shifted its role from resistance to support. A similar phenomenon is observed at the $360 level.

Mark Zuckerberg announced yesterday that by the end of 2024, the company's computing infrastructure would include 350,000 nVidia H100 graphics cards (designed for AI, costing between $25k and $40k each, according to CNBC).

It is not ruled out that riding on the positive momentum, the price of META shares may surpass the historical high. The publication of META's Q4 2023 performance report is scheduled for February 1, 2024.


This article represents the opinion of the Companies operating under the FXOpen brand only. It is not to be construed as an offer, solicitation, or recommendation with respect to products and services provided by the Companies operating under the FXOpen brand, nor is it to be considered financial advice.
I trade at FXOpen

User avatar
whiteking
rank: 150+ posts
rank: 150+ posts
Posts: 350
Joined: Fri Aug 11, 2017 2:25 am
Reputation: 32
Gender: None specified

Re: Daily analysis from FXOpen

Postby whiteking » Mon Jan 22, 2024 1:14 pm

USD/JPY: The Yen Pauses in Anticipation of the Bank of Japan's Decision
Image

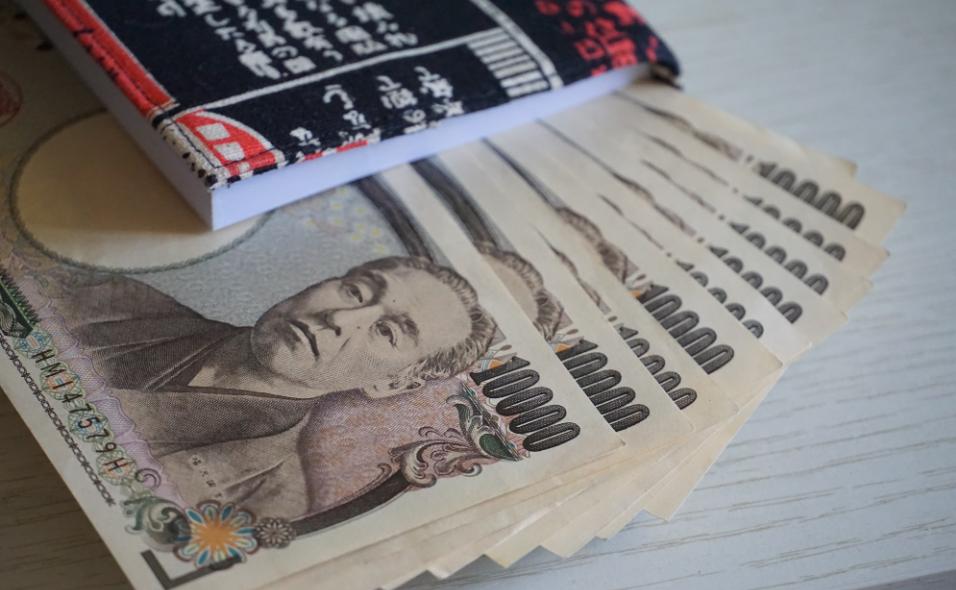
In 2024, the yen has significantly depreciated against other currencies. The USD/JPY chart indicates that since the first trading day of January, the exchange rate has risen by more than 5%. However, since the 18th, there has been a lull, and it may be disrupted today or tomorrow due to the Bank of Japan's meeting, during which comments on monetary policy will be provided.

According to Reuters, traders expect that interest rates will not be raised, remaining in the negative territory. This expectation is based on recent "peaceful" comments from the Bank of Japan, coupled with the country facing a serious test in the form of an earthquake on the west coast.

Image

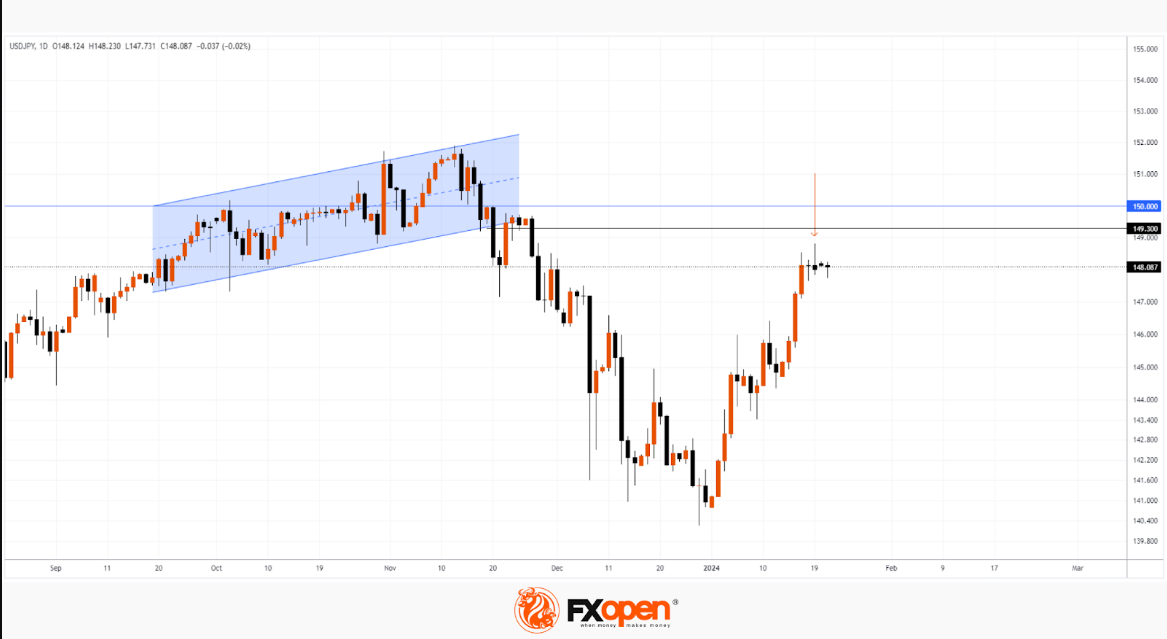
Today's technical analysis of USD/JPY suggests that buyers may have lost momentum as the price approached the psychological level of 150 yen per dollar. Judging by the long upper shadow (indicated by the arrow) on January 19, selling forces were activated. This could be attributed to either profit-taking by buyers after the rally in the first half of January or the opening of new short positions.

Pay attention to an important resistance zone (shown in blue). The bearish breakthrough occurred around the 149.3 level, confirming bearish dominance at the end of the previous year. It is possible that this dominance may persist, supporting the idea that the current calm may be disrupted in favour of the bears.

This article represents the opinion of the Companies operating under the FXOpen brand only. It is not to be construed as an offer, solicitation, or recommendation with respect to products and services provided by the Companies operating under the FXOpen brand, nor is it to be considered financial advice.
I trade at FXOpen

User avatar
whiteking
rank: 150+ posts
rank: 150+ posts
Posts: 350
Joined: Fri Aug 11, 2017 2:25 am
Reputation: 32
Gender: None specified

Re: Daily analysis from FXOpen

Postby whiteking » Tue Jan 23, 2024 2:30 pm

The Price of Bitcoin Has Dropped Below 40,000: What's Next?
Image

The value of the main cryptocurrency has fallen below the psychological mark for the first time since December 4th of last year. According to on-chain metrics services, the decline in the price of Bitcoin on cryptocurrency exchanges triggered the liquidation of buyer positions for more than 25 million dollars in just 2 hours.

This decline confirms the significance of the three black crows pattern (indicated by the arrow) and the principle of "buy the rumour, sell the fact" - as we discussed in the Bitcoin price analysis on January 15th.

What's next? Will the price continue to decrease?

JPM head Jamie Dimon, as well as legendary investor Peter Schiff, are pessimistic. In their opinion, Bitcoin is a speculative asset. Jamie Dimon explicitly advises staying away from bitcoins, while Peter Schiff, comparing Bitcoin to gold, prefers the precious metal.

On the other hand, the current decrease may indicate a correction within an upward trend. This perspective is held by financial expert and publicist Anthony Scaramucci.

Image

Today's Bitcoin chart shows that:

  • |-> BTC/USD has dropped not only below the psychological mark but also below the lower boundaries A and B of the channels, shown in blue and purple on the chart.
  • |-> The RSI indicator points to oversold conditions.

If the market shows signs of recovery, then:

  • |-> the nature of this recovery (comparing the speed, volumes, and progress achieved relative to the decline from the peaks on January 11th) will provide important information to determine the strength or weakness of demand in the market;
  • |-> the important psychological level at 40,000 will be considered support, an attempt to break which has failed. So far, bears are aiming to establish themselves below $40k. If they succeed, the psychological level may pose resistance in the future.

As long as the price of Bitcoin is below 44,000 (approximately 50% from the January peak), we may consider that the initiative is on the bears' side.


This article represents the opinion of the Companies operating under the FXOpen brand only. It is not to be construed as an offer, solicitation, or recommendation with respect to products and services provided by the Companies operating under the FXOpen brand, nor is it to be considered financial advice.
I trade at FXOpen

User avatar
whiteking
rank: 150+ posts
rank: 150+ posts
Posts: 350
Joined: Fri Aug 11, 2017 2:25 am
Reputation: 32
Gender: None specified

Re: Daily analysis from FXOpen

Postby whiteking » Wed Feb 07, 2024 1:57 pm

A Major Network Outage in Solana Had Little Impact on the SOL/USD Exchange Rate
Image

Solana, one of the fastest-growing blockchain networks, experienced significant outages yesterday, starting around 13:00 GMT+3. As a result of the outage, users and developers were unable to process transactions and interact with applications.

Solana engineers quickly released a patch required for the restart. And about four hours later, the network came back online, as validators, collectively controlling 80% of SOL staking, updated to the new version.

This is not the first time the Solana network has experienced downtime.

According to SolanaCompass.com, the main Solana network has been in "beta mode" (error detection mode) since March 2020 and is still operating as such. Approximately 1.7 billion dollars' worth of capital is locked in the project's network, and SOL, its native token, ranks as the fifth-largest cryptocurrency with a market capitalization of nearly 42 billion dollars.

In 2023, the SOL/USD rate rose by a staggering +960%, and fortunately for investors, yesterday's outage had little impact on the price of the Solana token (and other crypto assets).

Image

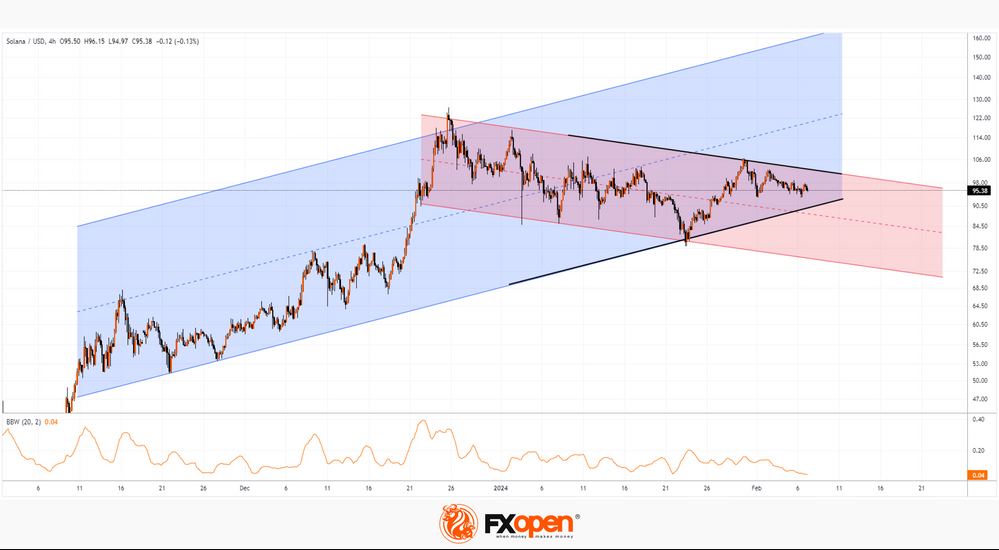
Meanwhile, today's SOL/USD chart shows an interesting picture – the price seems to have temporarily stalled before choosing a direction in which to move:

→ On the one hand, the SOL/USD price is within the bounds of an ascending uptrend (shown in blue), which began in 2023;

→ On the other hand, the chart outlines a descending channel (shown in red).

Meanwhile, the Bollinger Bands width indicator is at minimal values, as if hinting that the SOL/USD price exiting the triangle forming on the chart (shown in black lines) may be associated with increased volatility and the formation of a new important swing.

This article represents the opinion of the Companies operating under the FXOpen brand only. It is not to be construed as an offer, solicitation, or recommendation with respect to products and services provided by the Companies operating under the FXOpen brand, nor is it to be considered financial advice.
I trade at FXOpen

Please add www.kreslik.com to your ad blocker white list.
Thank you for your support.


Return to “forex”