Daily analysis from FXOpen

forex live trades, setups, charts

Moderator: moderators

User avatar
whiteking
rank: 150+ posts
rank: 150+ posts
Posts: 350
Joined: Fri Aug 11, 2017 2:25 am
Reputation: 32
Gender: None specified

Re: Daily analysis from FXOpen

Postby whiteking » Wed Dec 20, 2023 12:45 pm

Market Analysis: Gold Price Eyes Breakout, Crude Oil Price Recovers
Image

Gold price gained traction and climbed above the $2,030 resistance level. Crude oil price is recovering, and it could climb further higher toward the $78 resistance.

Important Takeaways for Gold and Oil Prices Analysis Today

  • Gold price started a decent increase from the $1,975 zone against the US Dollar.
  • A connecting bullish trend line is forming with support near $2,030 on the hourly chart of gold at FXOpen.
  • Crude oil prices rallied above the $71.00 and $73.00 resistance levels.
  • There is a key bullish trend line forming with support near $73.00 on the hourly chart of XTI/USD at FXOpen.

Gold Price Technical Analysis

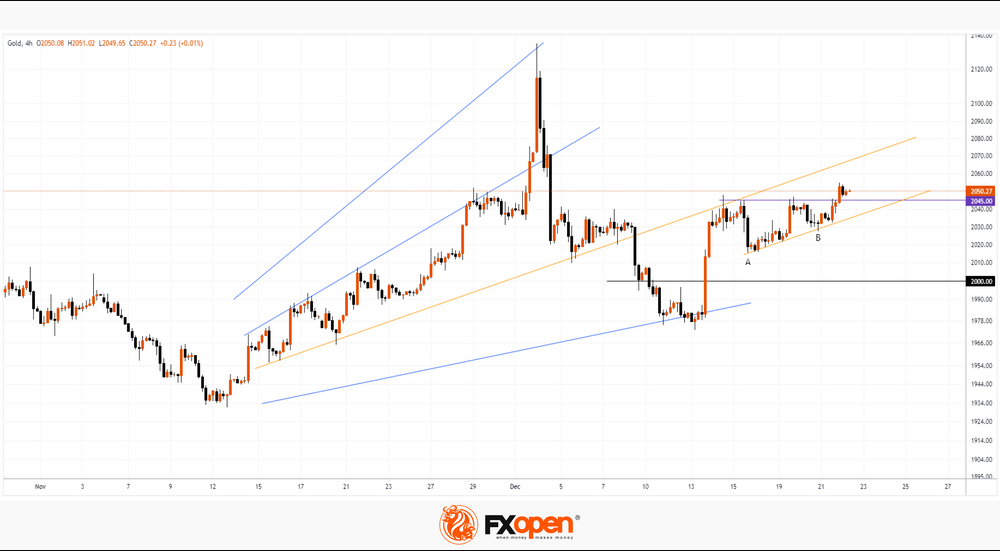
On the hourly chart of Gold at FXOpen, the price found support near the $1,975 zone. The price formed a base and started a fresh increase above the $1,990 level.

There was a decent move above the 50-hour simple moving average. The bulls pushed the price above the $2,030 resistance zone. Finally, the bears appeared near $2,045, A high is formed near $2,046.99 and the price is now consolidating gains.

Image

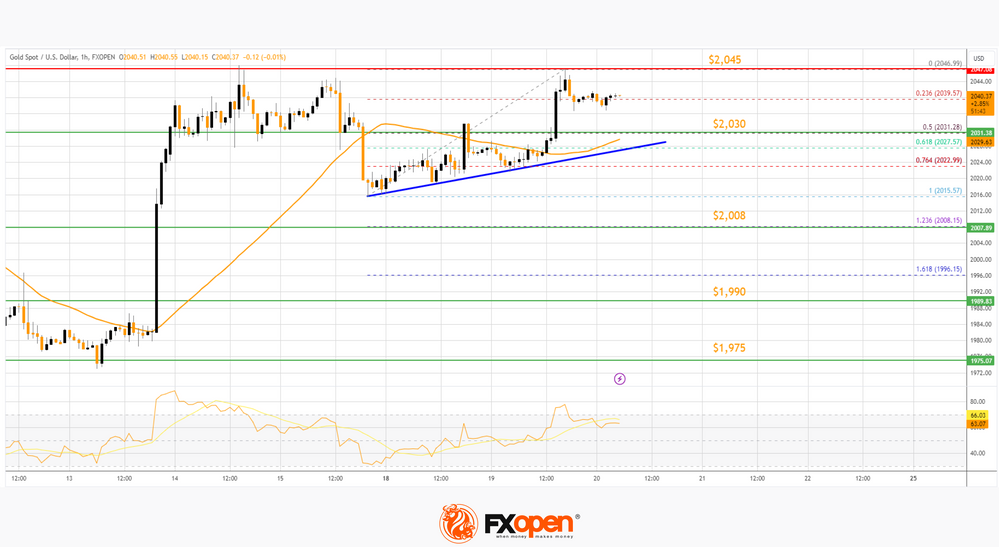
There was a minor move below the 23.6% Fib retracement level of the upward move from the $2,015 swing low to the $2,046 high. The RSI is still stable above 50 and the price could aim for more gains. Immediate resistance is near the $2,045 level.

The next major resistance is near the $2,050 level. An upside break above the $2,050 resistance could send Gold price toward $2,065. Any more gains may perhaps set the pace for an increase toward the $2,080 level.

Initial support on the downside is near the 50-hour simple moving average or $2,030. There is also a connecting bullish trend line forming with support near $2,030. The trend line is close to the 61.8% Fib retracement level of the upward move from the $2,015 swing low to the $2,046 high.

If there is a downside break below the $2,030 support, the price might decline further. In the stated case, the price might drop toward the $2,008 support.


This article represents the opinion of the Companies operating under the FXOpen brand only. It is not to be construed as an offer, solicitation, or recommendation with respect to products and services provided by the Companies operating under the FXOpen brand, nor is it to be considered financial advice.
I trade at FXOpen

Please add www.kreslik.com to your ad blocker white list.
Thank you for your support.

User avatar
whiteking
rank: 150+ posts
rank: 150+ posts
Posts: 350
Joined: Fri Aug 11, 2017 2:25 am
Reputation: 32
Gender: None specified

Re: Daily analysis from FXOpen

Postby whiteking » Thu Dec 21, 2023 11:40 am

S&P 500: Worst Day since September
Image

The S&P 500 fell 70.02 points, or 1.47%, to 4,698.35 yesterday, according to Dow Jones Newswires. This is the largest one-day point decline since Thursday, September 21, 2023.

Of the 500 stocks in the index, only 19 closed in the green. Of these, Google shares, as the company announced plans to reorganize its advertising department, which employs 30 thousand people.

From a fundamental perspective, there were no obvious triggers that carried enough weight to cause the sharp decline. Moreover, the Consumer Confidence indicator was published yesterday, which showed that consumer confidence has increased the most since the beginning of 2021.

Image

From the point of view of behavioral psychology and technical analysis, the sharp decline has reasonable explanations:

  • -> from the low of late October to the beginning of yesterday's session, the S&P 500 index grew by 16%. This is an impressive rally, fueled by expectations of easing inflation and interest rate cuts in 2024. A significant correction is a logical development of events.
  • -> The market was overbought, as indicated by the RSI indicator. The indicator also pointed to divergence - a sign of weakening demand.
  • -> Buyers might want to lock in profits. And as yesterday's decline progressed, they could have rushed to do so, thereby accelerating the decline. It is logical to want to withdraw money and not hold positions during the holiday period.

It is important to take into account that the price of the S&P 500 was near important resistances:

  • -> near the historical maximum (by the way, the E-mini S&P 500 futures market exceeded the maximum);
  • -> near the upper border of the ascending channel (shown in blue).

Thus, the price of the S&P 500 dropped to support around 4,700. But it is possible that after yesterday’s decline, the market may receive additional bearish impulse at the opening of the American session. If the bears maintain the initiative shown yesterday, it is possible that they will be able to lower the price of the S&P 500 to the median line of the ascending channel.


This article represents the opinion of the Companies operating under the FXOpen brand only. It is not to be construed as an offer, solicitation, or recommendation with respect to products and services provided by the Companies operating under the FXOpen brand, nor is it to be considered financial advice.
I trade at FXOpen

User avatar
whiteking
rank: 150+ posts
rank: 150+ posts
Posts: 350
Joined: Fri Aug 11, 2017 2:25 am
Reputation: 32
Gender: None specified

Re: Daily analysis from FXOpen

Postby whiteking » Fri Dec 22, 2023 1:09 pm

Price of Gold on the Rise amid US GDP Slowdown
Image

Yesterday's data for last quarter showed that US GDP growth was estimated at 4.9% year-on-year, although GDP growth was expected to remain unchanged at 5.2%.

This disappointing performance could put pressure on the Fed to cut rates. After data is published:
  • -> the market has increased the likelihood of a rate cut by March to 83% from 79%, as evidenced by FedWatch;
  • -> the dollar index fell.
At the same time, the weakening dollar gave a bullish impetus to the price of gold, which exceeded the USD 2,050 level for the first time since December 4. By the way, returning to the analysis that we did on December 5, we note that the fan-shaped structure of trend lines remains relevant.

As predicted at the beginning of the month, the price broke below the USD 2,000 level and tested the lower line of the structure, followed by a price return above the psychological level.

Image

As the graph shows:
  • -> before breaking through the resistance at USD 2,045, the price formed a bullish cup- and-handle pattern. Rising A-B lows may indicate increased buying pressure;
  • -> the price may continue to develop within the channel shown by the yellow lines.
Further developments will most likely be influenced by the publication of Core PCE Price Index data (today at 16:30 GMT+3). It is possible that the bulls will try to reach the upper yellow line.

This article represents the opinion of the Companies operating under the FXOpen brand only. It is not to be construed as an offer, solicitation, or recommendation with respect to products and services provided by the Companies operating under the FXOpen brand, nor is it to be considered financial advice.
I trade at FXOpen

User avatar
whiteking
rank: 150+ posts
rank: 150+ posts
Posts: 350
Joined: Fri Aug 11, 2017 2:25 am
Reputation: 32
Gender: None specified

Re: Daily analysis from FXOpen

Postby whiteking » Tue Dec 26, 2023 1:14 pm

Solana Is the Fourth Largest Cryptocurrency by Capitalisation. But for How Long?
Image

2023 turned out to be a good year for cryptocurrencies, especially given the depressing mood that reigned at the end of 2022.

From the beginning of 2023:

  • Bitcoin increased in price by more than 150% - including due to rumours related to the approval of applications for a Bitcoin ETF;
  • Ethereum rose by approximately 85%.

But what has been particularly impressive is the progress made by the Solana project. This is a decentralised blockchain platform, which is characterised by high speed and scalability - they are achieved through the use of a unique architecture based on the Proof-of-History (PoH) protocol. In 2023, Solana became the first blockchain platform to reach 50,000 transactions per second. And a number of large investment funds, such as Grayscale and CoinShares, have added SOL to their portfolios.

SOL is a token that is used to pay for transactions and services on the Solana platform. It can also be used for staking to help support the network. The SOL/USD rate in 2023 has increased by more than 1000%!

At the same time, SOL now ranks 4th in terms of capitalisation of cryptocurrencies - after BTC, ETH, and the USDT stablecoin. December was the month when the price of the SOL token exceeded the psychological level of USD 100 for the first time since April 2022 (the historical high reached in the fall of 2021 exceeds the USD 250 level for SOL).

But will the price be able to stay above USD 100?

Image

The 4-hour chart on the FXOpen TickTrader platform shows that:

  • the price broke through the USD 100 level, but did not test it;
  • the price broke through the level of USD 110, which confirmed its role as support;
  • the price reached the upper limit of the ascending channel, which began in early November.

At the same time, the chart shows bearish signs:

  • the price sharply reversed from the upper border of the channel on the last closed candle;
  • divergences formed on the RSI indicator.

In such a situation, you should be prepared for a scenario in which the SOL/USD price may fall - for example, to test the USD 100 level. In this case, the market can be supported by the median line of the channel.

This article represents the opinion of the Companies operating under the FXOpen brand only. It is not to be construed as an offer, solicitation, or recommendation with respect to products and services provided by the Companies operating under the FXOpen brand, nor is it to be considered financial advice.
I trade at FXOpen

User avatar
whiteking
rank: 150+ posts
rank: 150+ posts
Posts: 350
Joined: Fri Aug 11, 2017 2:25 am
Reputation: 32
Gender: None specified

Re: Daily analysis from FXOpen

Postby whiteking » Wed Dec 27, 2023 12:52 pm

EUR/USD Extends Rally While USD/JPY Revisits Support
Image

EUR/USD gained bullish momentum above the 1.0985 resistance. USD/JPY is declining and showing bearish signs below the 142.85 level.

Important Takeaways for EUR/USD and USD/JPY Analysis Today

  • The Euro remained in a bullish zone and climbed above the 1.0985 resistance zone.
  • There is a key bullish trend line forming with support near 1.1020 on the hourly chart of EUR/USD at FXOpen.
  • USD/JPY is trading in a bearish zone below the 143.40 and 142.85 levels.
  • There was a break above a major bearish trend line with resistance near 142.25 on the hourly chart at FXOpen.

EUR/USD Technical Analysis

On the hourly chart of EUR/USD at FXOpen, the pair started a fresh increase above the 1.0930 zone. The Euro climbed above the 1.0985 resistance zone against the US Dollar.

The pair even settled above the 1.1020 resistance and the 50-hour simple moving average. Finally, it tested the 1.1040 resistance. A high is formed near 1.1044 and the pair is now consolidating gains.

If there is a downside correction, the pair might test the 23.6% Fib retracement level of the upward move from the 1.0929 swing low to the 1.1044 high at 1.1020. There is also a key bullish trend line forming with support near 1.1020 and the 50-hour simple moving average.

The next major support is near the 50% Fib retracement level of the upward move from the 1.0929 swing low to the 1.1044 high at 1.0985.

If there is a downside break below 1.0985, the pair could drop toward the 1.0930 support. The main support on the EUR/USD chart is near 1.0910, below which the pair could start a major decline.

On the upside, the pair is now facing resistance near 1.1040. The next major resistance is near the 1.1065 level. An upside break above 1.1065 could set the pace for another increase. In the stated case, the pair might rise toward 1.1120.

Image


This article represents the opinion of the Companies operating under the FXOpen brand only. It is not to be construed as an offer, solicitation, or recommendation with respect to products and services provided by the Companies operating under the FXOpen brand, nor is it to be considered financial advice.
I trade at FXOpen

Please add www.kreslik.com to your ad blocker white list.
Thank you for your support.

User avatar
whiteking
rank: 150+ posts
rank: 150+ posts
Posts: 350
Joined: Fri Aug 11, 2017 2:25 am
Reputation: 32
Gender: None specified

Re: Daily analysis from FXOpen

Postby whiteking » Thu Dec 28, 2023 10:52 am

ETH/USD Analysis: New Record of the Year
Image

Today, the price of Ethereum exceeded the level of 2,440 per token, thereby setting a new high for 2023. It is noteworthy that the price of Bitcoin did not support the bullish sentiment, continuing to fluctuate around the USD 43,000 level for the fifth day.

What is the reason for the growth of ETH/USD from a fundamental point of view? There is no obvious trigger in the media, so we can only make assumptions:

  • -> market participants considered ETH an undervalued asset against the backdrop of the growth of Bitcoin and Solana;
  • -> perhaps buyers assume that after the expected approval of applications for the BTC ETF, the ETH ETF story will be next?
  • -> Santa's rally and the positive sentiment associated with it.

Image

From a technical point of view, the price of ETH/USD moved up beyond the balance period “B”, where the forces of supply and demand were balanced. The bullish momentum was maintained, with upward momentum above the 2,333 level attracting followers and forcing short sellers to take losses. According to on-chain analytical platforms, in just one hour, at the peak of growth, USD 14 million of bearish positions were liquidated on cryptocurrency exchanges-there was a short squeeze in the market to some extent.

What's next? Will the price be able to form a new balance period “C”, which will be above the period “B” (similar to the trend “A” -> “B”)?

This morning, on the 4-hour chart, a bearish engulfing pattern is forming, which may result in a false breakout of the previous top on December 9, when the SHS pattern was formed - this is not a very optimistic development of events.

However, as long as the price remains above the level of 2,333, there is reason to believe that the market is on the way to forming a balance “C”, which is above the balance “B” - similar to what happened with the level of 2,110. A bearish breakdown of the level of 2,333 and a return to the zone balance “B” will mean an alarming signal: buyers have lost strength, and therefore the next breakdown of balance “B” may occur in a downward direction.

This article represents the opinion of the Companies operating under the FXOpen brand only. It is not to be construed as an offer, solicitation, or recommendation with respect to products and services provided by the Companies operating under the FXOpen brand, nor is it to be considered financial advice.
I trade at FXOpen

User avatar
whiteking
rank: 150+ posts
rank: 150+ posts
Posts: 350
Joined: Fri Aug 11, 2017 2:25 am
Reputation: 32
Gender: None specified

Re: Daily analysis from FXOpen

Postby whiteking » Fri Dec 29, 2023 1:47 pm

Market Analysis: AUD/USD and NZD/USD Regain Strength

AUD/USD is moving higher and might climb further above 0.6870. NZD/USD is also rising and could extend its increase above the 0.6370 resistance zone.

Important Takeaways for AUD USD and NZD USD Analysis Today

  • The Aussie Dollar started a fresh increase above the 0.6760 and 0.6800 levels against the US Dollar.
  • There is a bullish flag forming with resistance near 0.6845 on the hourly chart of AUD/USD at FXOpen.
  • NZD/USD is gaining bullish momentum above the 0.6320 support.
  • There is a short-term contracting triangle forming with support near 0.6320 on the hourly chart of NZD/USD at FXOpen.

AUD/USD Technical Analysis

On the hourly chart of AUD/USD at FXOpen, the pair started a fresh increase from the 0.6725 support. The Aussie Dollar was able to clear the 0.6760 resistance to move into a positive zone against the US Dollar.

There was a close above the 0.6800 resistance and the 50-hour simple moving average. Finally, the pair tested the 0.6870 zone. A high is formed near 0.6869 and the pair is now consolidating gains.

There was a minor move below the 23.6% Fib retracement level of the upward move from the 0.6724 swing low to the 0.6869 high.

On the downside, initial support is at 0.6820. The next support could be the 50% Fib retracement level of the upward move from the 0.6724 swing low to the 0.6869 high at 0.6800. If there is a downside break below the 0.6800 support, the pair could extend its decline toward the 0.6760 zone.

Any more losses might signal a move toward 0.6660. On the upside, the AUD/USD chart indicates that the pair is now facing resistance near 0.6845. There is also a bullish flag forming with resistance near 0.6845.

The first major resistance might be 0.6870. An upside break above the 0.6870 resistance might send the pair further higher. The next major resistance is near the 0.6920 level. Any more gains could clear the path for a move toward the 0.7000 resistance zone.
Image


This article represents the opinion of the Companies operating under the FXOpen brand only. It is not to be construed as an offer, solicitation, or recommendation with respect to products and services provided by the Companies operating under the FXOpen brand, nor is it to be considered financial advice.
I trade at FXOpen

User avatar
whiteking
rank: 150+ posts
rank: 150+ posts
Posts: 350
Joined: Fri Aug 11, 2017 2:25 am
Reputation: 32
Gender: None specified

Re: Daily analysis from FXOpen

Postby whiteking » Wed Jan 03, 2024 12:43 pm

Market Analysis: GBP/USD Retreats From Highs, USD/CAD Grinds Higher
Image

GBP/USD declined below the 1.2715 support zone. USD/CAD is rising and might aim for more gains above the 1.3330 resistance.

Important Takeaways for GBP/USD and USD/CAD Analysis Today

  • The British Pound started a fresh decline below the 1.2715 support zone.
  • There is a key bearish trend line forming with resistance near 1.2680 on the hourly chart of GBP/USD at FXOpen.
  • USD/CAD is showing positive signs above the 1.3260 support zone.
  • There was a break above a major bearish trend line with resistance near 1.3260 on the hourly chart at FXOpen.

GBP/USD Technical Analysis

On the hourly chart of GBP/USD at FXOpen, the pair started a fresh decline from the 1.2820 zone. The British Pound traded below the 1.2715 support to move further into a bearish zone against the US Dollar.

The pair even traded below 1.2680 and the 50-hour simple moving average. Finally, the bulls appeared near the 1.2610 level. A low was formed near 1.2610 and the pair is now attempting a recovery wave.

Immediate resistance on the upside is near the 23.6% Fib retracement level of the downward move from the 1.2827 swing high to the 1.2610 low at 1.2660. The first major resistance is near a key bearish trend line at 1.2680 or the 50-hour simple moving average.

A close above the 1.2680 resistance might spark a steady upward move. The next major resistance is near the 50% Fib retracement level of the downward move from the 1.2827 swing high to the 1.2610 low at 1.2715. Any more gains could lead the pair toward the 1.2820 resistance in the near term.

Initial support sits near 1.2610. The next major support is at 1.2565, below which there is a risk of another sharp decline. In the stated case, the pair could drop towards 1.2500.

Image

This article represents the opinion of the Companies operating under the FXOpen brand only. It is not to be construed as an offer, solicitation, or recommendation with respect to products and services provided by the Companies operating under the FXOpen brand, nor is it to be considered financial advice.
I trade at FXOpen

User avatar
whiteking
rank: 150+ posts
rank: 150+ posts
Posts: 350
Joined: Fri Aug 11, 2017 2:25 am
Reputation: 32
Gender: None specified

Re: Daily analysis from FXOpen

Postby whiteking » Thu Jan 04, 2024 1:22 pm

Traders Adjust Their Expectations for Fed Action
Image

From the beginning of November to the end of December 2023, the dollar index futures price fell by approximately 5.5%, according to the CME exchange. The weakening of the USD was caused by the sentiment of traders who expected the Fed to cut interest rates in March. As a result of the sentiment that prevailed at the end of 2023, stock indices, gold (setting a historical maximum on December 4) and cryptocurrencies rose.

However, the start of 2024 indicated a sharp change in sentiment, with the dollar index futures price rising more than 1% during the January 3-4 sessions.

This can be interpreted as:

  • -> during the pre-holiday period, there was a certain emotional component that helped to look into the future with optimism;
  • -> after the end of the holidays, market participants adjusted their expectations regarding the easing of the Fed's actions.

Data released yesterday showed that there is no clear indication that the Fed may start cutting rates, as its members still see the need for policy to remain restrictive for some time.

That is, in the first days of 2024, there was a correction of bullish sentiment at the end of 2023. In the cryptocurrency market, which is characterised by a high degree of margin (opening positions with borrowed funds), the correction turned into an avalanche of sales — the BTC/USD rate dropped rapidly to the level of $41,000, forming a false bullish breakout of the consolidation zone at the end of 2023, which we wrote about yesterday.

We also note the decline in the NASDAQ technology stock index, which, according to Bloomberg, showed the worst start to the year since 2001 (the time of the dot-com crash).

Image


The NASDAQ-100 chart shows that:

  • -> the stock index price is still within the uptrend (shown in blue);
  • -> the price was within the intermediate correction (shown in red), forming a flag pattern;
  • -> the psychological level of 17,000 served as resistance.

The price may be supported by:

  • -> the psychological level of 16,000, which was broken by the bulls after some consolidation in the second half of December;
  • -> the median line of the ascending channel;
  • -> a level of 50% of the A-B growth impulse, located around the level of 15,500.

Price action near these levels (if reached) will provide more valuable information about how much sentiment has changed since the bullish end to 2023.


This article represents the opinion of the Companies operating under the FXOpen brand only. It is not to be construed as an offer, solicitation, or recommendation with respect to products and services provided by the Companies operating under the FXOpen brand, nor is it to be considered financial advice.
I trade at FXOpen

User avatar
whiteking
rank: 150+ posts
rank: 150+ posts
Posts: 350
Joined: Fri Aug 11, 2017 2:25 am
Reputation: 32
Gender: None specified

Re: Daily analysis from FXOpen

Postby whiteking » Fri Jan 05, 2024 2:46 pm

USD/JPY: The Price Reaches Resistance at 145 Yen per US Dollar
Image

As of Friday morning, the situation on the USD/JPY market deserves attention:

  • -> the US dollar is on course to demonstrate its strongest week since July 2023. The media writes that markets are adjusting expectations regarding the easing of monetary policy by the Fed.
  • -> The yen fell about 3% against the US dollar in the first week of the year, which could be its weakest weekly performance since August 2022.

Image

The USD/JPY chart shows that:

  • -> the price moves within the descending channel (shown in red). Growth at the beginning of the year expanded its boundaries along the principle of a parallel channel.
  • -> the median line has been broken by the bulls. The price action around 142 shows increased demand. The price could not consolidate below this level in December, serving as a powerful support for ending panic on December 7 and 14-15. Also, demand forces did not allow the price to reach the lower border of the channel on December 28.

Note that the bulls managed to break above the psychological level of 145, something they failed to do on December 19 when a notable high was formed. Thus, the market is in a vulnerable position for a pullback from the upper boundary of the channel after rapid growth in the first days of the year. If this happens, a false bullish breakout of the psychological level of 145 will form on the chart. The bears will have a chance to resume the trend, but given the listed signs of demand strength around the 142 yen per dollar level, they will have to make significant efforts to do this.

Be careful, today at 16:30 GMT+3 there will be news on the labour market in the US, which may affect the USD exchange rate.


This article represents the opinion of the Companies operating under the FXOpen brand only. It is not to be construed as an offer, solicitation, or recommendation with respect to products and services provided by the Companies operating under the FXOpen brand, nor is it to be considered financial advice.
I trade at FXOpen

Please add www.kreslik.com to your ad blocker white list.
Thank you for your support.


Return to “forex”