Daily analysis from FXOpen

forex live trades, setups, charts

Moderator: moderators

User avatar
whiteking
rank: 150+ posts
rank: 150+ posts
Posts: 350
Joined: Fri Aug 11, 2017 2:25 am
Reputation: 32
Gender: None specified

Re: Daily analysis from FXOpen

Postby whiteking » Wed Dec 06, 2023 1:12 pm

Market Analysis: WTI Oil Price Drops to Lowest Level Since July
Image

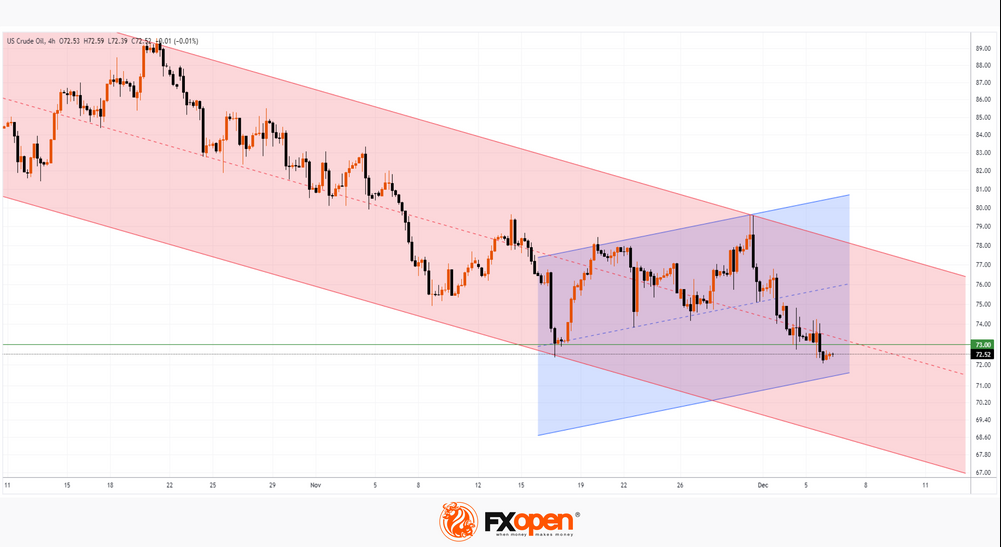
As the chart shows, the price of a barrel of US crude oil dropped below 72.10 per barrel yesterday for the first time since July 2023.

Fundamentally, this happened against the backdrop of:
  • Statistics showing that US oil exports are increasing. Volume is approaching a record 6 million barrels per day, with flows to Europe and Asia showing steady growth.
  • Previously announced measures to reduce oil production by OPEC+. However, either the price has already taken these statements into account in advance, or market participants are not confident that the reduction in OPEC+ supplies will be fully implemented - one way or another, so far the OPEC+ countries have not achieved the desired increase in oil prices. Perhaps, in order to discuss the oil market, Russian President Putin is flying to the UAE and Saudi Arabia today. And Deputy Prime Minister Alexander Novak said OPEC+ is ready to deepen oil production cuts in the first quarter of 2024 to eliminate “speculation and volatility” if existing production reduction measures are not enough.
Image

From a technical analysis point of view:

  • the price of oil continues to develop its dynamics within the descending channel (shown in red);
  • the rising channel (shown in blue) looks like an intermediate correction within a larger decline. The lower boundary of the parallel channel may provide support for the current decline;
  • yesterday's update to the low was very small, it looks like a false breakout of the November low. The bears seem unsure, but they may make a new attempt if there is a successful test of the level of $73 per barrel, which worked as support in early December, but today may provide resistance. Also pay attention to the lower boundary of the downward channel, where sellers can take profits from short positions.


This article represents the opinion of the Companies operating under the FXOpen brand only. It is not to be construed as an offer, solicitation, or recommendation with respect to products and services provided by the Companies operating under the FXOpen brand, nor is it to be considered financial advice.
I trade at FXOpen

Please add www.kreslik.com to your ad blocker white list.
Thank you for your support.

User avatar
whiteking
rank: 150+ posts
rank: 150+ posts
Posts: 350
Joined: Fri Aug 11, 2017 2:25 am
Reputation: 32
Gender: None specified

Re: Daily analysis from FXOpen

Postby whiteking » Thu Dec 07, 2023 1:19 pm

AUD/JPY Analysis: Rate Falls to Important Support
Image

This morning, the AUD/JPY rate dropped below 95.2 yen per Australian dollar for the first time since late October.

The weakening of the AUD was contributed by:
  • -> negative news regarding the Chinese economy. The Hang Seng Index set its 2023 low yesterday;
  • -> Australian GDP data published yesterday, which is growing at a weaker-than-expected pace.
    [/lit]
    And the strengthening of the yen occurs against the backdrop of expectations of an increase in interest rates in Japan, which intensified according to the statement of the head of the Bank of Japan. Kazuo Ueda said yesterday the central bank has several options for targeting interest rates once it gets short-term borrowing costs out of negative territory.

    Image

    At the same time, the AUD/JPY chart shows that:
    • -> the rate has reached important support from the lower border of the channel shown in blue;
    • -> the rate has broken through the level of 96.25, and now the level may act as resistance;
    • -> RSI dropped into the extreme oversold zone. This increases the temptation for bears to take profits.
Given these factors, it is reasonable to assume that the market is vulnerable to a short-term bullish correction after a strong downward impulse. However, if the current fundamental background does not change, the strengthening yen may break through important support in the pair against AUD in December (which is also true for other currencies).

This article represents the opinion of the Companies operating under the FXOpen brand only. It is not to be construed as an offer, solicitation, or recommendation with respect to products and services provided by the Companies operating under the FXOpen brand, nor is it to be considered financial advice.
I trade at FXOpen

User avatar
whiteking
rank: 150+ posts
rank: 150+ posts
Posts: 350
Joined: Fri Aug 11, 2017 2:25 am
Reputation: 32
Gender: None specified

Re: Daily analysis from FXOpen

Postby whiteking » Fri Dec 08, 2023 1:37 pm

NIKKEI Analysis: Japanese Stock Market Outlook
Image

In the first half of 2023, the Japanese stock market was dominated by bullish sentiment due to (still) negative interest rates - while the rest of the G7 countries raised their rates to combat inflation.

The NIKKEI-225 index grew by 30% in the first half of the year. But then the balance of supply and demand was achieved, judging by the daily chart, where a range was formed (shown in blue), framing the index’s fluctuations in the second half of the year. Judging by the change in the slope of the bullish trend lines, demand was sufficient to maintain the price at the lower limit of the range, but not enough to go beyond the upper limit.

The situation is fundamentally reversed. While interest rates in the US, Europe and elsewhere are thought to be near the top, there is growing talk in Japan that the central bank will begin raising them after years of being stuck in negative territory:
  • -> Bloomberg: The next meeting of the Bank of Japan will be held on December 19 -speculation is growing that the Bank will move away from negative interest rates as early as this month.
  • -> Reuters: 22 of 26 economists (85%) surveyed in November believe the Bank of Japan will abandon its negative interest rate policy by the end of next year.
The winding down of ultra-loose monetary policy could have a negative impact on the growth of Japanese companies - accordingly, the growing bearish sentiment is reflected in the index quote. Since the end of November, the NIKKEI 225 has dropped almost 5%.
Image

The chart shows that the November top:
  • -> did not exceed the annual maximum set in June;
  • -> only slightly exceeded the September high - in fact, a false breakout;
  • -> the price forms a rounding (shown by an arrow) - a sign of gradual depletion of demand, which is replaced by the dominance of supply.
It is possible that the bears, which are gaining power, will be able to form a breakdown of the median line of the blue channel as early as December.

This article represents the opinion of the Companies operating under the FXOpen brand only. It is not to be construed as an offer, solicitation, or recommendation with respect to products and services provided by the Companies operating under the FXOpen brand, nor is it to be considered financial advice.
I trade at FXOpen

User avatar
whiteking
rank: 150+ posts
rank: 150+ posts
Posts: 350
Joined: Fri Aug 11, 2017 2:25 am
Reputation: 32
Gender: None specified

Re: Daily analysis from FXOpen

Postby whiteking » Mon Dec 11, 2023 2:08 pm

Sharp Change in BTC/USD Price: Causes and Consequences
Image

On Monday morning, the price of bitcoin fell sharply. As the chart shows, the BTC/USD rate fell below 42,000 on Monday during the Asian session. According to Coinglass, the decline resulted in about $400 million worth of positions being liquidated by about 100,000 traders on cryptocurrency exchanges. So far, the price has found support around the 41,200 level, where the lower border of the ascending channel lies (shown in blue).

What are the reasons for such a sharp decline? From a fundamental point of view, there are no triggers with the media associated with, for example, statements by officials. What then?

First of all, the idea comes with low liquidity in the financial markets at the beginning of Monday in the Asian session. A recent example is the gold market, when the price of the metal jumped at the opening of trading to $2,130, but then quickly fell to $2,060. By the way, we wrote on Tuesday that the bears may try to push the price of gold below the psychological level of $2,000. The scenario is still coming true.

Image

What will happen to bitcoin? The graph shows that:
  • -> the price was within consolidation for some time (shown in green);
  • -> On December 8, the year’s maximum was updated, which in fact turned out to be a trap, a false bullish breakout of the consolidation zone (a bearish sign);
  • -> this morning, there was a bearish breakdown of the consolidation zone.

After 8 weeks of gains, we can assume that the market is overbought and today's decline is an overdue correction after a rally of more than 70% from the September lows.

But corrections, as a rule, are characterized by smoother declines with decreasing volumes. And if we analyze the nature of the decline on Monday morning, it looks more like an impulse.

Of course, given the high leverage that is applied in the poorly regulated crypto market, it is reasonable to assume that the correction took this form due to the cascading triggering of buyers’ stop losses. On the other hand, what if insiders are actively selling bitcoin, knowing that the coming week will bring a dose of negativity on the fundamental background?

One way or another, if the price of bitcoin reaches a psychological level, then analyzing the patterns on the chart will provide important information. It is possible that the price will break below the $40k level, and it will provoke an upward rebound - the nature of which will provide valuable material for reasoning about whether the current decline is an overdue correction or a bearish reversal.


This article represents the opinion of the Companies operating under the FXOpen brand only. It is not to be construed as an offer, solicitation, or recommendation with respect to products and services provided by the Companies operating under the FXOpen brand, nor is it to be considered financial advice.
I trade at FXOpen

User avatar
whiteking
rank: 150+ posts
rank: 150+ posts
Posts: 350
Joined: Fri Aug 11, 2017 2:25 am
Reputation: 32
Gender: None specified

Re: Daily analysis from FXOpen

Postby whiteking » Tue Dec 12, 2023 3:58 pm

Market Analysis: Financial Markets Waiting for Important News
Image

Get ready for a surge in volatility in the coming days, because:
  • -> today at 16:30 GMT+3: news will be published on inflation in the USA;
  • -> tomorrow at 22:00-22:30 GMT+3: news from the Federal Reserve on the interest rate will be published;
  • -> on Thursday: news from the central banks of Europe, Great Britain, Switzerland will be published.
Add in geopolitical tensions, the possibility of Biden's impeachment, news on unemployment and retail sales in the US and other factors affecting prices — this week is likely to be very turbulent before financial market participants go on holiday.

The greatest optimism reigns in the stock market. The S&P 500 index updated its maximum for the year. Because investors believe that inflation will continue to cool, and over time the Federal Reserve will cut rates, giving new impetus to corporate growth. This expectation is probably already factored into the current price, so deviations from expectations can trigger unexpected price movements.

Image

Assessing the EUR/USD chart, we can note that:
  • -> the psychological level of 1.100 worked as resistance, as we expected on November 29;
  • -> the rate is near the lower border of the ascending channel, however, energetic price rebounds, which are typical when touching the lower border in strong bullish markets, are not observed;
  • -> level 1.0835 changed its action from support to resistance (as the arrows show).
In general, it is very likely that the reaction to each subsequent news can adjust the reaction to each previous one. Therefore, the likelihood of falling into a trap in the EUR/USD market increases, for example, in a likely scenario of a false rebound from the lower border of the ascending channel followed by its bearish breakdown, which will support the strengthening of the USD, which unfolds in December, as indicated by EMA(100).


This article represents the opinion of the Companies operating under the FXOpen brand only. It is not to be construed as an offer, solicitation, or recommendation with respect to products and services provided by the Companies operating under the FXOpen brand, nor is it to be considered financial advice.
I trade at FXOpen

Please add www.kreslik.com to your ad blocker white list.
Thank you for your support.

User avatar
whiteking
rank: 150+ posts
rank: 150+ posts
Posts: 350
Joined: Fri Aug 11, 2017 2:25 am
Reputation: 32
Gender: None specified

Re: Daily analysis from FXOpen

Postby whiteking » Wed Dec 13, 2023 1:07 pm

Will the BoE Reduce Interest Rates or Not? Markets Appear Nonchalant
Image

The Bank of England is expected to keep interest rates at the current level at tomorrow's meeting and is not actively pursuing further increases in the near future. More intriguingly, economists are now contemplating the possibility of a reduction in interest rates in the upcoming new year. This development, if realised, could carry noteworthy implications for both the British public and businesses.

The potential shift in policy is anticipated to be welcomed by a broad spectrum of the British populace, encompassing both commercial entities and private individuals. The prospect of reduced interest rates holds the promise of easing financial burdens, particularly on mortgage payments. Such a scenario would likely translate into increased disposable income for the public, empowering them to resume previous spending patterns. Simultaneously, businesses could find relief as lower interest rates would facilitate easier servicing of monthly commitments, allowing for redirected funds towards development, growth, and expansion initiatives.

Comparisons with the economic landscape of the United States reveal distinctive differences in approach. While both the UK and the US faced challenges of inflation surges, the UK's inflation rate, though reduced, remains at a level of just over 5.6%. In contrast, the US has achieved a lower inflation rate of 3.2%. Despite this, the Bank of England is diverging from the US policy trajectory by contemplating a departure from further interest rate hikes.

A key metric distinguishing the two economies is the national debt, with the UK presenting a substantially lower debt level on both a percentage and per capita basis. Furthermore, the absence of financial institution collapses, a contrast to events in the US earlier in the year, contributes to a relatively more stable financial environment in the UK.

Image

The British pound, which had experienced a sudden rise against the US dollar in recent days, has demonstrated a shift in momentum. Trading at 1.2530 at FXOpen against the dollar, the pound slightly retreated from yesterday’s close at 1.2569.

Examining broader economic indicators, British GDP exhibited flat growth in the third quarter, aligning with the Monetary Policy Committee's projections. However, inflation and wage growth fell short of expectations, and domestic demand remained weak. In contrast, the US witnessed healthier productivity levels.


Trade global forex with the Innovative Broker of 2022*. Choose from 50+ forex markets 24/5. Open your FXOpen account now or learn more about trading forex with FXOpen.

* FXOpen International, best ECN broker of 2022, according to the IAFT

This article represents the opinion of the Companies operating under the FXOpen brand only. It is not to be construed as an offer, solicitation, or recommendation with respect to products and services provided by the Companies operating under the FXOpen brand, nor is it to be considered financial advice.


Get trading idea here
Read more...
I trade at FXOpen

User avatar
whiteking
rank: 150+ posts
rank: 150+ posts
Posts: 350
Joined: Fri Aug 11, 2017 2:25 am
Reputation: 32
Gender: None specified

Re: Daily analysis from FXOpen

Postby whiteking » Thu Dec 14, 2023 2:40 pm

Market Analysis: Powell's Speech Weakens USD
Image

Yesterday, the Federal Reserve published a unanimous decision to leave the base rate unchanged for the third time in a row, which coincided with the expectations of most market participants. At the conference that followed, Powell's rhetoric was not as harsh as before. According to him:

  • -> economic activity is slowing, but the labor market remains strong;
  • -> inflation is still high, the Fed is committed to achieving the 2% target;
  • -> rates may rise if the US economy grows above expectations;
  • -> during discussions within the Fed, the topic of lowering rates becomes more relevant.

As a result, the increasingly clear prospect of rate cuts weakened the dollar greatly:

  • -> increased currency price relative to USD. The pound rose in price from the important support of 1.25, which we wrote about yesterday.
  • -> gold rose in price, again rising above the psychological level of $2,000 per ounce, as we expected in the analysis of December 5;
  • -> US stock indices rose in price.

Image

In particular, the Dow Jones index set a historical maximum, and the S&P 500 is close to it.

The graph shows that:
  • -> the price of the S&P 500 forms an ascending channel (shown in blue). The bearish breakout at the end of October turned out to be false;
  • -> after yesterday’s events, the price rose to the upper half of the channel, indicating positive sentiment in the market;
  • -> if the trend continues, the price may reach the upper boundary of the channel - while setting a historical maximum;
  • -> the resistance at 4,600 has been confidently broken, in the future it can serve as support;
  • -> RSI is in the overbought zone – the highest this year on the daily time frame;
  • -> it is possible that after a stormy week the S&P 500 will cool down - that is, consolidate, with the probability of testing the level of 4,700.


This article represents the opinion of the Companies operating under the FXOpen brand only. It is not to be construed as an offer, solicitation, or recommendation with respect to products and services provided by the Companies operating under the FXOpen brand, nor is it to be considered financial advice.
I trade at FXOpen

User avatar
whiteking
rank: 150+ posts
rank: 150+ posts
Posts: 350
Joined: Fri Aug 11, 2017 2:25 am
Reputation: 32
Gender: None specified

Re: Daily analysis from FXOpen

Postby whiteking » Fri Dec 15, 2023 1:34 pm

EUR/USD: Price Is Again Testing Psychological Level of 1.10
Image

An eventful news background creates increased volatility in financial markets.

Unlike the Fed, whose rhetoric is becoming softer, Europe's central banks are sticking to plans to maintain tight policies. The ECB said yesterday that policy easing was not even discussed at its two-day meeting, the Bank of England said rates would remain high for an "extended period," and Norway's central bank even raised rates.

This caused the pound and euro to rise sharply yesterday against a weakened USD.

However, today is the day of publication of PMI indices in Europe, which show that the economy in Europe is in a difficult situation, as the values ​​are below = 50:
  • -> French Flash Manufacturing PMI: actual = 42.0, expected = 43.3, previously = 42.9;
  • -> German Flash Services PMI: actual = 48.4, expected = 49.1, previously = 49.6.

The publication of PMI values today led to a sharp depreciation of the euro against the dollar, thus a correction occurred after a rally of two days.

Image

At the same time, the EUR/USD chart shows that:

  • -> the price tested the psychological level of 1.10 for the second time. We wrote about the first puncture in the review on November 29;
  • -> the EUR/USD rate has been within the ascending channel (shown in blue) since October, however, the level of 1.10 creates an obstacle for the bulls, who probably see the goal of reaching the upper boundary of the channel;
  • -> the important level 1.075 acted as support. Bulls can also count on support from the median line of the ascending channel.
Tonight at 17:45 GMT+3 US PMI data will be published. Also in the US derivatives market, expirations of about $5.3 trillion are expected, which could provoke additional turbulence.

It is possible that we may see the formation of rising lows, which can be interpreted as efforts of the bulls to overcome the level of 1.10.

This article represents the opinion of the Companies operating under the FXOpen brand only. It is not to be construed as an offer, solicitation, or recommendation with respect to products and services provided by the Companies operating under the FXOpen brand, nor is it to be considered financial advice.
I trade at FXOpen

User avatar
whiteking
rank: 150+ posts
rank: 150+ posts
Posts: 350
Joined: Fri Aug 11, 2017 2:25 am
Reputation: 32
Gender: None specified

Re: Daily analysis from FXOpen

Postby whiteking » Mon Dec 18, 2023 12:58 pm

USD/CAD Analysis: Rate Reaches Its Minimum in 4 Months
Image

On Friday, the rate dropped below 1.366 for the first time since the beginning of August. This was facilitated by fundamental drivers:
  • -> The US dollar weakens after the Federal Reserve meeting, which signaled the possibility of lowering interest rates next year. Powell said monetary tightening is likely complete and discussions about cuts are "on the horizon."
  • -> On the contrary, the Bank of Canada remains more hawkish. In a speech on Friday, its chief Tiff Macklem said it was too early to consider cutting interest rates as inflation remained stubbornly above target.
Also, the weakening of the US dollar could have been influenced by disappointing news about Flash Manufacturing PMI values in the US: actual = 48.2, expectations = 49.5, a month earlier = 49.4.

We wrote about bearish signs on the chart back on December 1st.

Image

The current 4-hour chart shows that:
  • -> the USD/CAD price forms a downward channel (shown in red). What is noteworthy is that the price dropped to its lower limit (potential support);
  • -> the RSI indicator indicates a strong oversold market;
  • -> the price only dropped slightly below the September low, and then consolidated intraday - forcing attention to the formation of a false breakout of the low.
Taking into account the above arguments, it is worth assuming a scenario of a rebound from the lower border of the channel. For example, it is possible that the price will test the area 1.346-1.348, or the former support 1.355, resistance from which may be strengthened by the median line of the channel.

This article represents the opinion of the Companies operating under the FXOpen brand only. It is not to be construed as an offer, solicitation, or recommendation with respect to products and services provided by the Companies operating under the FXOpen brand, nor is it to be considered financial advice.
I trade at FXOpen

User avatar
whiteking
rank: 150+ posts
rank: 150+ posts
Posts: 350
Joined: Fri Aug 11, 2017 2:25 am
Reputation: 32
Gender: None specified

Re: Daily analysis from FXOpen

Postby whiteking » Tue Dec 19, 2023 1:23 pm

Market Analysis: USD/JPY and NIKKEI React to Bank of Japan Decision
Image

This morning, the Bank of Japan decided to leave interest rates unchanged at -0.10%. Its head, Kazuo Ueda, stated that:
  • -> the chances that the current ultra-loose monetary policy will change in January are very small;
  • -> further decisions of the Bank of Japan will be based on incoming economic information.
Thus, rumors that the Bank of Japan might raise rates from the negative zone did not come true. As a result, the NIKKEI index rose to November highs, and the yen weakened.

Image

The 4 hour USD/JPY chart shows that:
  • -> The price forms a downward channel (shown in red). The strengthening of the yen against the US dollar, observed since November, was caused by both rumors related to the Bank of Japan and the prospect of a rate cut by the Federal Reserve.
  • -> The lower border of the channel pushed the price upward on December 7, indicating support at 141.65.
  • -> On December 14, there was an attempt at a bearish breakdown of this support. But instead of developing a downward movement to another touch with the lower border of the channel, the price entered into consolidation (an early bullish sign), which lasted until the end of last week and marked the resistance level of 142.5.
  • -> The closer the Bank of Japan's decision was, the stronger the bulls became. After breaking through the level of 142.5, it was tested. Moreover, not only the level of 142.5, but also the median line of the channel showed its support role.
The upward momentum that the USD/JPY market has received may develop during today's American session. It is possible that the quote will reach resistance at 145 yen per dollar, which is strengthened by the upper boundary of the downward channel.


This article represents the opinion of the Companies operating under the FXOpen brand only. It is not to be construed as an offer, solicitation, or recommendation with respect to products and services provided by the Companies operating under the FXOpen brand, nor is it to be considered financial advice.
I trade at FXOpen

Please add www.kreslik.com to your ad blocker white list.
Thank you for your support.


Return to “forex”