Daily analysis from FXOpen

forex live trades, setups, charts

Moderator: moderators

User avatar
whiteking
rank: 150+ posts
rank: 150+ posts
Posts: 350
Joined: Fri Aug 11, 2017 2:25 am
Reputation: 32
Gender: None specified

Re: Daily analysis from FXOpen

Postby whiteking » Mon Apr 24, 2023 1:23 pm

Market Analysis: GBP/USD Eyes Bullish Breakout While EUR/GBP Consolidates Losses
Image

GBP/USD is eyeing a key upside break above the 1.2470 resistance zone. EUR/GBP is now consolidating losses above the 0.8825 support.

Important Takeaways for GBP/USD and EUR/GBP
  • The British Pound is slowly moving higher from the 1.2365 support against the US Dollar.
  • There is a key bearish trend line forming with resistance near 1.2440 on the hourly chart of GBP/USD at FXOpen.
  • EUR/GBP started a downside correction from the 0.8860 resistance zone.

    · There is a major bullish trend line forming with support near 0.8825 on the hourly chart at FXOpen.

GBP/USD Technical Analysis

On the hourly chart of GBP/USD at FXOpen, the pair found support near the 1.2365 zone. The British Pound formed a base and started a decent increase above the 1.2400 resistance against the US Dollar.

The pair even spiked above 1.2440 and the 50-hour simple moving average. However, upsides remained capped near the 1.2470 zone. The pair is now consolidating near the 50-hour simple moving average and the 23.6% Fib retracement level of the upward move from the 1.2367 swing low to the 1.2451 high.

Image

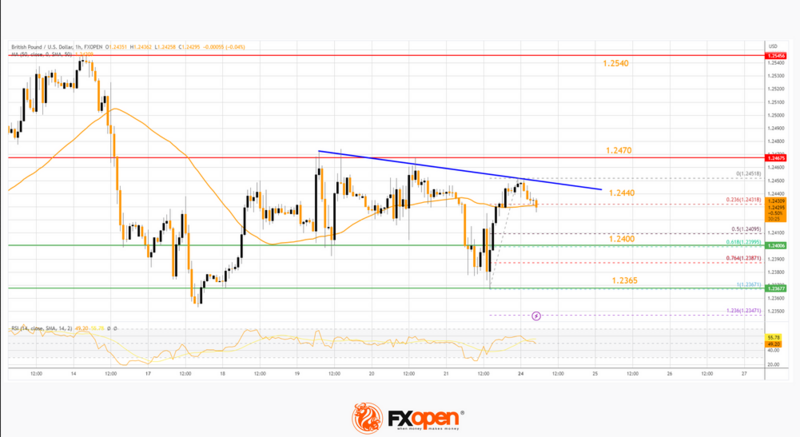
On the downside, there is a major support forming near the 61.8% Fib retracement level of the upward move from the 1.2367 swing low to the 1.2451 high at 1.2400.

The next major support is near the 1.2365 level. If there is a downside break below the 1.2365 support, there is a risk of a sharp decline. In the stated case, GBP/USD may perhaps revisit the 1.2300 support. Any more losses could lead the pair toward the 1.2250 support.

On the upside, resistance is near a key bearish trend line at 1.2440. The pair might attempt a fresh increase if the RSI stays above 50. The next major resistance is near the 1.2470 level. A clear move above the 1.2470 level could spark a rally toward the 1.2540 level.

Disclaimer: CFDs are complex instruments and come with a high risk of losing your money.
I trade at FXOpen

Please add www.kreslik.com to your ad blocker white list.
Thank you for your support.

User avatar
whiteking
rank: 150+ posts
rank: 150+ posts
Posts: 350
Joined: Fri Aug 11, 2017 2:25 am
Reputation: 32
Gender: None specified

Re: Daily analysis from FXOpen

Postby whiteking » Tue Apr 25, 2023 2:11 pm

BTC/USD: Bullish Engulfing Pattern Above $26,981
Image

Bitcoin continues its bullish momentum from last week, and after touching a low of $26,981 on April 24, we can see a move towards a consolidation phase, after which we are expecting upsides in the range of $28500 and $302000.

We can clearly see a bullish engulfing pattern above the $26,981 handle on the H1 timeframe.

Bitcoin continues to move in a consolidation phase, after which we can see upside moves towards the $28,000 handle.

Both the STOCH and Williams’ percent range indicate overbought levels, which means that in the immediate short term, a decline in the price is expected.

We can also see the formation of bullish Harami pattern in the 1, 2 and 4 hourly timeframes.
Image

The relative strength index is at 58.23, indicating a strong demand for Bitcoin and the continuation of the buying pressure in the markets.

Bitcoin is now moving above its 200-hour exponential moving average and above its 200-hour exponential moving average.

Most of the major technical indicators are giving a bullish signal, which means that in the immediate short term, we are expecting targets of $28,500 and $30,000.

The average true range indicates high market volatility with mild bullish momentum.
  • Bitcoin bullish continuation is seen above $26,981.
  • The RSI remains above 50, indicating a bullish market.
  • The price is now trading below its pivot level of $28,516.
  • The short-term range is mildly bullish.
  • Some major technical indicators signal that the price may move to $28,000 and $29,500 soon.
Bitcoin Bullish Continuation Seen Above $26,981

The price of Bitcoin entered a consolidation zone below the $28,000 handle after which we can see the start of the bullish moves.

There is a bullish trend reversal pattern with adaptive moving average AMA-20 and AMA-50 in the 30-minutes timeframe.

The prices are ranging near the support of the triangle in the 1-hourly timeframe.

We have also seen a Bullish Doji located in the 15-minutes timeframe.

A support zone is located at $26,246, which is a 3-10 Day MACD Oscillator Stalls, and at $26,624, which is a 38.2% Retracement from 13 Week High.

BTCUSD is now facing its classic resistance level of $28,015 and Fibonacci resistance level of $28,508, breaking which the price will be able to move to $29,000.

There is an increase of 4.64% in the daily trading volume, which is normal. The short-term outlook for Bitcoin is bullish, the medium-term outlook has turned bullish, and the long-term outlook remains neutral under present market conditions.

The Week Ahead
Image

We can see that Bitcoin remains well supported above the $27,000 handle and the continuation pattern is seen, with the current support at $25,143, which is a 38.2% Retracement from 52-week low.

The immediate expected target is $29,000, after which we may see some consolidation in the zone of the $29,500 level.

Monthly RSI is at 49.68, which indicates the Neutral market and the shift towards the consolidation zone in the medium-term range.

We can see the formation of a bullish trend line from $26,981 to $28,355.

BTCUSD is now facing resistance at $27,943, which is a pivot point 1st resistance point, and at 28,152, at which the price crosses 18 day moving average stalls.

This article represents FXOpen Companies’ opinion only, it should not be construed as an offer, solicitation, or recommendation with respect to FXOpen Companies’ products and services or as financial advice.

*At FXOpen UK and FXOpen AU, Cryptocurrency CFDs are only available for trading by those clients categorised as Professional clients under FCA Rules and Professional clients under ASIC Rules respectively. They are not available for trading by Retail clients.
I trade at FXOpen

User avatar
whiteking
rank: 150+ posts
rank: 150+ posts
Posts: 350
Joined: Fri Aug 11, 2017 2:25 am
Reputation: 32
Gender: None specified

Re: Daily analysis from FXOpen

Postby whiteking » Wed Apr 26, 2023 12:43 pm

AUDUSD Analysis: Breakout of Important Support

Image

Yesterday's report showed that inflation in Australia in the first quarter of 2023 fell from a 33-year high. The consumer price index rose only by 1.4% in annual terms, although analysts had expected +1.9%.

Now market participants are focusing on the meeting of the Reserve Bank of Australia on May 2; it is expected that it will resume raising rates and thereby complete the pause made after a series of 10 increases.

Image

Reacting to the news, the Australian dollar broke through the low of April, while the daily AUDUSD chart shows that the market as a whole looks weak, because:

-> important support (1), which has been in effect since autumn 2022, has been breached;

-> rebounds from this line were weak, the price did not reach the median line (2);

-> MA (200) points down.

The bears may make even more progress today, as at 15:30 (GMT+3) the US GDP and unemployment news will be published, which may strengthen the USD.

This article represents FXOpen Companies’ opinion only, it should not be construed as an offer, solicitation, or recommendation with respect to FXOpen Companies’ products and services or as financial advice.
I trade at FXOpen

User avatar
whiteking
rank: 150+ posts
rank: 150+ posts
Posts: 350
Joined: Fri Aug 11, 2017 2:25 am
Reputation: 32
Gender: None specified

Re: Daily analysis from FXOpen

Postby whiteking » Thu Apr 27, 2023 2:48 pm

ETHUSD Analysis: The Morning Star Pattern above $1,786
Image

Bulls were able to take control of the market, and after touching a low of $1,786 on 26 April, the ETH/USD pair is showing bullish momentum, touching a high of $1,938 today in the early Asian trading session.

Image

ETHUSD is under mild bullish pressure after its decline below the $1,800 handle due to improved investor sentiment and support seen at lower levels.

The morning star pattern is above the $1,786 handle on the H1 timeframe. It's a bullish pattern, which signifies the end of a bearish phase.

The price is above the Ichimoku cloud in the 15-minutes timeframe.

ETH is back above the pivot point, indicating the bullish pressure in the market.

The relative strength index is at 57.13, indicating a strong demand for Ether and a continuation of the buying pressure in the market.

The STOCHRSI is giving neutral, meaning that the price is expected to enter into a consolidation zone in the short-term range.

We also detected the formation of the bullish trend reversal pattern with the 50-period moving average in the 15-minutes timeframe.

Most of the technical indicators are bullish. Most moving averages are bullish at the current market level of $1,885.

ETH is now trading above the 200-hour simple and 200-hour exponential moving averages.
  • ETH bullish reversal is seen above the $1,786 mark.
  • The short-term range is expected to be mildly bullish.
  • The average true range indicates high market volatility.
ETH Bullish Reversal Is above $1,786
Image

On the daily chart, ETH is trading just above its pivot level of $1,874 and is moving into a mild bullish channel. The price is about to break its classic resistance level of $1,955 and its Fibonacci resistance level of $2,044; supports are $1,808 and $1,845.

The key support levels to watch are $1,845, which is a 38.2% retracement from the 13-week high, and $1,862, which is a 14-3 daily raw stochastic at 20.

The Week Ahead

ETH continues to correct higher above $1,800, which indicates the bullish momentum, and is expected to move towards the $1,900 level in the medium-term range in the H1 timeframe.

We see a short-term bullish trend line forming from $1,786 towards the $1,954 level.

There is a minor bullish trend line with the resistance at $1,971, which is a 38.2% retracement from a 4-week high.

The immediate short-term outlook for ETH has turned mildly bullish, the medium-term outlook has turned bullish, and the long-term outlook is neutral in present market conditions.

The resistance zone is at $2,034, which is a 14-3 day raw stochastic at 70, and at $2,106, at which the price crosses the 9-day moving average.

The weekly outlook is $2,000 with a consolidation zone of $1,900.

This article represents FXOpen Companies’ opinion only, it should not be construed as an offer, solicitation, or recommendation with respect to FXOpen Companies’ products and services or as financial advice.


*At FXOpen UK and FXOpen AU, Cryptocurrency CFDs are only available for trading by those clients categorised as Professional clients under FCA Rules and Professional clients under ASIC Rules respectively. They are not available for trading by Retail clients.
I trade at FXOpen

User avatar
whiteking
rank: 150+ posts
rank: 150+ posts
Posts: 350
Joined: Fri Aug 11, 2017 2:25 am
Reputation: 32
Gender: None specified

Re: Daily analysis from FXOpen

Postby whiteking » Fri Apr 28, 2023 11:57 am

Market Analysis: Gold Price and Crude Oil Price Face Key Hurdles
Image

Gold price is struggling to gain momentum above the $2,003 resistance. Crude oil price is consolidating losses and struggling to recover above $75.20.

Important Takeaways for Gold and Oil
  • Gold price seems to be trading in a range below the $2,010 resistance against the US Dollar.
  • A key bullish trend line is forming with support near $1,982 on the hourly chart of gold at FXOpen.
  • Crude oil prices declined heavily below the $79.00 and $76.50 support levels.
  • There is a major bearish trend line forming with resistance near $75.20 on the hourly chart of XTI/USD at FXOpen.

Gold Price Technical Analysis

On the hourly chart of Gold at FXOpen, the price formed a base above the $1,976 support zone. The price started a decent increase and was able to clear the $2,003 resistance zone.

However, the bears were active near the $2,010 resistance. There were more than two attempts to clear the $2,010 resistance but the bulls failed. It reacted to the downside and retested the $1,976 support.

Image

The price is now rising and trading near the 50% Fib retracement level of the recent decline from the $2,003 swing high to the $1,974 low. Initial support on the downside is near a key bullish trend line at $1,982.

The first major support is near the $1,976 level. The main support sits near the $1,971 level. If there is a downside break below the $1,971 support, the price might decline heavily.

The next major support is near $1,960, below which the bulls could aim for a test of $1,950. On the upside, the bulls are facing resistance near the 50-hour simple moving average at $1,992. It coincides with the 61.8% Fib retracement level of the recent decline from the $2,003 swing high to the $1,974 low.

An upside break above the $1,992 resistance could send the price toward $2,003. Any more gains may perhaps set the pace for an increase toward the $2,010 level.

This article represents FXOpen Companies’ opinion only, it should not be construed as an offer, solicitation, or recommendation with respect to FXOpen Companies’ products and services or as financial advice.
I trade at FXOpen

Please add www.kreslik.com to your ad blocker white list.
Thank you for your support.

User avatar
whiteking
rank: 150+ posts
rank: 150+ posts
Posts: 350
Joined: Fri Aug 11, 2017 2:25 am
Reputation: 32
Gender: None specified

Re: Daily analysis from FXOpen

Postby whiteking » Tue May 02, 2023 12:50 pm

Market Analysis: Unexpected Interest Rate Hike In Australia Strengthens AUD
Image

According to Reuters, market participants were waiting for a pause in a series of interest rate hikes, as the data showed a slowdown in inflation. However, the Reserve Bank of Australia on Tuesday raised the rate by 25 basis points.

"Inflation in Australia has passed its peak, but at 7 percent is still too high and it will be some time yet before it is back in the target range," said governor Philip Lowe.

As a result, the Australian dollar jumped by about 1% against major currencies. It's a tumultuous start to the week after May 1, which was a public holiday for the financial industry in many countries. Note that news from the Reserve Bank of New Zealand, as well as from the Fed, is expected tomorrow.

Image

Meanwhile, the daily chart of AUDUSD shows a promising bullish pattern — a false bearish breakdown (1) of the lower border of the rising channel. In the most favorable scenario for the bulls, the rate may continue to rise towards a (3) year high, however (2) resistance at 0.678 is on the way — it will help to reveal how strong the demand in the AUDUSD market is.

This article represents FXOpen Companies’ opinion only, it should not be construed as an offer, solicitation, or recommendation with respect to FXOpen Companies’ products and services or as financial advice.
I trade at FXOpen

User avatar
whiteking
rank: 150+ posts
rank: 150+ posts
Posts: 350
Joined: Fri Aug 11, 2017 2:25 am
Reputation: 32
Gender: None specified

Re: Daily analysis from FXOpen

Postby whiteking » Wed May 03, 2023 9:03 am

Market Analysis: EUR/USD Restarts Increase While USD/JPY Corrects After Rally
Image

EUR/USD started a fresh increase above the 1.1000 resistance. USD/JPY rallied significantly above 137.00 and recently started a downside correction.

Important Takeaways for EUR/USD and USD/JPY
  • The Euro is rising and gaining pace above the 1.1000 resistance zone.
  • There was a break above a key bearish trend line with resistance near 1.1000 on the hourly chart of EUR/USD at FXOpen.
  • USD/JPY started a major rally above the 136.00 and 137.00 levels.
  • There was a break below a key bullish trend line with support near 137.45 on the hourly chart at FXOpen.

EUR/USD Technical Analysis

On the hourly chart of EUR/USD at FXOpen, the pair formed a base above the 1.0945 level. The Euro started a fresh increase above the 1.0965 resistance against the US Dollar.

There was a move above a key bearish trend line with resistance near 1.1000 and the 50-hour simple moving average. The pair is now trading above the 50% Fib retracement level of the downward move from the 1.1095 swing high to the 1.0972 low.

Image

It is now facing resistance near the 61.8% Fib retracement level of the downward move from the 1.1095 swing high to the 1.0972 low at 1.1035.

The next major resistance is near the 1.1070 level. An upside break above 1.1070 could set the pace for another increase considering the hourly RSI is positioned nicely above 50. In the stated case, the pair might visit 1.1120. Any more gains might send the pair towards 1.1150.

If not, EUR/USD might start another decline from 1.1035. Initial support sits near the 1.1000 level. The first major support is near the 1.0965 level, below which the pair could start a major decline. In the stated case, the pair might dive toward the 1.0880 support zone.

This article represents FXOpen Companies’ opinion only, it should not be construed as an offer, solicitation, or recommendation with respect to FXOpen Companies’ products and services or as financial advice.
I trade at FXOpen

User avatar
whiteking
rank: 150+ posts
rank: 150+ posts
Posts: 350
Joined: Fri Aug 11, 2017 2:25 am
Reputation: 32
Gender: None specified

Re: Daily analysis from FXOpen

Postby whiteking » Thu May 04, 2023 12:59 pm

ETHUSD Analysis: Bullish Engulfing Pattern above $1,805
Image

Bulls were able to take control of the market, and after touching a low of $1,805 on May 1, the ETH/USD pair moved upwards, touching a high of $1,916 today in the early Asian trading session. The bullish engulfing pattern is above the $1,805 handle on the H1 timeframe. It's a bullish pattern, which signifies the end of a bearish phase.

Image

The market opened bullish this week. The ETH price remains well supported above the $1,800 level and is back above the pivot point.

The relative strength index is at 61.03, indicating a strong demand for Ether and a continuation of the buying pressure in the market.

Both the STOCH and CCI are neutral, meaning that the price is expected to enter into a consolidation zone in the short-term range.

A bullish reversal pattern with the 50-period moving average in the 2-hour timeframe was formed.

Most of the technical indicators are bullish. Most moving averages are bullish at the current Ethereum price of $1,899.

ETH is now trading above the 100-hour simple and 200-hour exponential moving averages.
  • ETH price is showing a bullish reversal above the $1,805 mark.
  • The short-term range is expected to be mildly bullish.
  • The average true range indicates low market volatility.
  • The ETH price ranges near the support of the channel.
ETH Bullish Reversal Is above $1,805
Image

On the daily chart, ETH is trading just below its pivot level of $1,900 and is moving in a mild bullish channel. The price is about to break its classic resistance level of $1,904 and its Fibonacci resistance level of $1,907. Supports are $1,870 and $1,886.

Some of the technical indicators signal neutral market sentiment.

We can see the formation of a bullish engulfing pattern in the 2-hour timeframe.

The key support levels to watch are $1,866, which is a 14-day RSI at 50, and $1,890, which is a 3-10 day MACD oscillator.

The Week Ahead

ETH price remains well supported above $1,800, indicative of the bullish momentum, and the next visible targets are located at $1,900 and $1,950 in the medium-term range in the H1 timeframe.

We see a short-term bullish trend line from $1,805 toward $1,912.

The immediate short-term outlook for ETH has turned mildly bullish, the medium-term outlook has turned bullish, and the long-term outlook is neutral in present market conditions.

The resistance zone is at $1,925, which is a 38.2% retracement from the 4-week low, and at $1,965, which is a 14-3 day raw stochastic at 50.

The weekly outlook is $2,000, with a consolidation zone of $1,970.

This article represents FXOpen Companies’ opinion only, it should not be construed as an offer, solicitation, or recommendation with respect to FXOpen Companies’ products and services or as financial advice.
I trade at FXOpen

User avatar
whiteking
rank: 150+ posts
rank: 150+ posts
Posts: 350
Joined: Fri Aug 11, 2017 2:25 am
Reputation: 32
Gender: None specified

Re: Daily analysis from FXOpen

Postby whiteking » Mon Jun 05, 2023 11:59 am

Gold Price and Crude Oil Price Weekly Chart Outlook
Image

Gold price remains supported for more gains above $2,000. Crude oil price is declining and might dive if there is a break below $65.00.

Important Takeaways for Gold and Oil Prices Analysis Today
  • Gold price rallied toward $2,080 before it started a downside correction against the US Dollar.
  • It is now trading above a connecting bullish trend line with support near $1,940 on the weekly chart of gold at FXOpen.
  • Crude oil prices are moving lower below $83.75 support.
  • There was a break below a major bullish trend line with support near $90.00 on the weekly chart of XTI/USD at FXOpen.

Gold Price Technical Analysis

On the weekly chart of Gold at FXOpen, the price started a fresh increase above the $1,870 resistance. The price gained pace and rallied above the $2,000 level.

There was a close above the 50-week simple moving average. It even surpassed $2,050 and tested $2,080. A high was formed near $2,081 before there was a downside correction. There was a move below the 23.6% Fib retracement level of the upward move from the $1,804 swing low to the $2,081 high.

Image

The price tested the 50% Fib retracement level of the upward move from the $1,804 swing low to the $2,081 high at $1,940.

The price is also trading above a connecting bullish trend line with support near $1,940. If there is a downside break, the price might decline toward the $1,870 support. The next major support is near $1,740, below which the bulls could aim for a test of $1,660.

On the upside, the price might face resistance near the $2,050 level. The next major resistance is near the $2,080 level. An upside break above the $2,080 resistance could send Gold price toward $2,120. Any more gains may perhaps set the pace for an increase toward the $2,200 level.

This article represents FXOpen Companies’ opinion only, it should not be construed as an offer, solicitation, or recommendation with respect to FXOpen Companies’ products and services or as financial advice.
I trade at FXOpen

User avatar
whiteking
rank: 150+ posts
rank: 150+ posts
Posts: 350
Joined: Fri Aug 11, 2017 2:25 am
Reputation: 32
Gender: None specified

Re: Daily analysis from FXOpen

Postby whiteking » Tue Jun 06, 2023 12:54 pm

Market Analysis: "Black Monday" for Crypto Community

Image

On June 5, it became known that the SEC filed a lawsuit against the largest cryptocurrency exchange Binance, collapsing the price of bitcoin and other cryptocurrencies.

Here is the essence of claims:
-> improper handling of customer funds,
-> misleading investors and regulators,
-> violation of the law on activities with "unregistered securities” — the stablecoins of the BUSD exchange, the native BNB token, as well as a number of cryptocurrencies.

In addition, a lawsuit was filed against the head of the Binance exchange, Changpeng Zhao, who hastened to reassure customers: do not give in to fears, the exchange continues its work.

Image

As a result, the price of bitcoin dropped sharply to a low in 80 days, while:
-> there was a bearish breakdown on high volumes of the long-term upward channel, which has been in effect since the beginning of the year (shown in blue);
-> the price of bitcoin has reached the lower limit of the descending channel (shown in red), where it has stabilized.

Over a quarter of a billion US dollars worth of buying positions have been liquidated on major crypto exchanges in the past 24 hours.

The bitcoin chart today suggests that the psychological level of USD 25k, which worked as resistance in February-March of this year, will contribute to the weakening of fears among market participants, and where the price of bitcoin can find support.

This article represents FXOpen Companies’ opinion only, it should not be construed as an offer, solicitation, or recommendation with respect to FXOpen Companies’ products and services or as financial advice.
I trade at FXOpen

Please add www.kreslik.com to your ad blocker white list.
Thank you for your support.


Return to “forex”