Daily analysis from FXOpen

forex live trades, setups, charts

Moderator: moderators

User avatar
whiteking
rank: 150+ posts
rank: 150+ posts
Posts: 350
Joined: Fri Aug 11, 2017 2:25 am
Reputation: 32
Gender: None specified

Re: Daily analysis from FXOpen

Postby whiteking » Mon Apr 10, 2023 1:06 pm

Technical Analysis: EUR/USD Aims Fresh Increase While EUR/JPY Eyes More Upsides
Image

EUR/USD is consolidating above the key 1.0880 support zone. EUR/JPY is rising and might rally further if it clears the 145.40 resistance zone.


Important Takeaways for EUR/USD and EUR/JPY
[LIST]
[*]The Euro started a downside correction from the 1.0970 zone.
[*]There is a key bearish trend line forming with resistance near 1.0910 on the hourly chart at FXOpen.
[*]EUR/JPY started a steady increase after it found support near 142.50.
[*]There is a major bullish trend line forming with support near 144.20 on the hourly chart.


EUR/USD Technical Analysis

On the hourly chart of EUR/USD, the Euro remained well-bid above the 1.0880 zone and started a fresh increase against the US Dollar. EUR/USD was able to break above the 1.0920 resistance level.

The pair tested the 1.0970 zone before it started a correction. There was a break below the 1.0920 level, but the bulls were active near the key 1.0880 support. A low is formed at 1.0876, and the pair is now consolidating.

Image

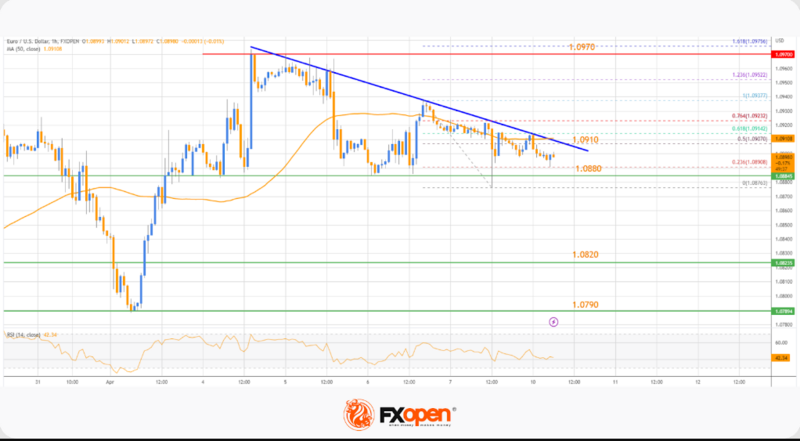
Immediate resistance is near the 1.0910 level. Besides, there is a key bearish trendline forming with resistance near 1.0910. The trendline is close to the 50% Fib retracement level of the downward move from the 1.0937 swing high to the 1.0876 low.

The next major resistance is near the 76.4% Fib retracement level at 1.0925. A clear move above the 1.0925 level might send the pair toward the 1.0970 level. Any more gains could set the pace for a test of 1.1000.

On the downside, the pair might find support near the 1.0880 level. The next major support sits near the 1.0820 level, below which the pair could even test the 1.0790 support zone.

If there is a downside break below the 1.0790 support, the pair might accelerate lower in the coming days. In the stated case, it could even test 1.0720.

Disclaimer: CFDs are complex instruments and come with a high risk of losing your money.
I trade at FXOpen

Please add www.kreslik.com to your ad blocker white list.
Thank you for your support.

User avatar
whiteking
rank: 150+ posts
rank: 150+ posts
Posts: 350
Joined: Fri Aug 11, 2017 2:25 am
Reputation: 32
Gender: None specified

Re: Daily analysis from FXOpen

Postby whiteking » Tue Apr 11, 2023 2:38 pm

Technical Analysis on USDJPY: Are Bulls Trying to Revive the Long-Term Trend?
Image

The USDJPY yesterday reached its highs of several weeks.

This was facilitated by:

- a statement by the new head of the Bank of Japan, Kazuo Ueda, who made it clear that there is no need to rush to curtail the stimulus policy;

- Friday's US employment report, which strengthened expectations of the Fed's interest rate hike in May. Unemployment fell to 3.5%, indicating the strength of the labour market. Trading on Tuesday, futures on the dollar index opened with a bullish gap;

- US commercial bank deposits rose towards the end of March for the first time in about a month, a sign that the banking crisis is easing and the dollar is regaining confidence.

The USDJPY weekly chart may give the idea that the bulls are trying to revive a long-term uptrend from the support line (1). However, for this it is necessary to overcome the resistance (2) around 133.75, the level can serve as an indicator of the real strength of demand.

Image

This forecast represents FXOpen Companies’ opinion only, it should not be construed as an offer, invitation, or recommendation with respect to FXOpen Companies’ products and services or as financial advice.

Disclaimer: CFDs are complex instruments and come with a high risk of losing your money.
I trade at FXOpen

User avatar
whiteking
rank: 150+ posts
rank: 150+ posts
Posts: 350
Joined: Fri Aug 11, 2017 2:25 am
Reputation: 32
Gender: None specified

Re: Daily analysis from FXOpen

Postby whiteking » Wed Apr 12, 2023 1:39 pm

Technical Analysis for April 12: GBP/USD Starts Fresh Increase While EUR/GBP Eyes Upside Break
Image

GBP/USD started a fresh increase above the 1.2400 resistance zone. EUR/GBP is struggling and facing resistance near 0.8790.

Important Takeaways for GBP/USD and EUR/GBP
  • The British Pound started a fresh increase above the 1.2400 barrier against the US Dollar.
  • There was a break above a key bearish trendline with resistance near 1.2410 on the hourly chart of GBP/USD.
  • EUR/GBP is struggling to break the 0.8790 resistance zone.
  • There is a major bullish trendline forming with support near 0.8770 on the EUR/GBP hourly chart.

GBP/USD Technical Analysis

This past week, the British Pound saw a downside correction below the 1.2400 support against the US Dollar. The GBP/USD pair tested the 1.2345 zone before the bulls took a stand.

Image

On the hourly chart at FXOpen, a low was formed near 1.2344, and the pair started a fresh increase. There was a clear move above the 1.2400 resistance zone. More importantly, there was a break above a key bearish trendline with resistance near 1.2410.

The pair traded at 1.2456 and settled above the 50-hour simple moving average. There was a minor downside correction below the 23.6% Fib retracement level of the upward move from the 1.2027 swing low to the 1.2205 high.

However, the pair remained well-bid above the 50% Fib retracement level at 1.2400.

If there is a downside break below the 1.2400 support, there is a risk of a sharp decline. In the stated case, GBP/USD may revisit the 1.2355 support. Any more losses could lead the pair toward 1.2300.

On the upside, resistance is near the 1.2355 level, above which the pair might resume its increase (considering the RSI is above 50). The next major resistance is near the 1.2520 level. A clear move above 1.2520 could trigger a rally toward 1.2600.

Disclaimer: CFDs are complex instruments and come with a high risk of losing your money.
I trade at FXOpen

User avatar
whiteking
rank: 150+ posts
rank: 150+ posts
Posts: 350
Joined: Fri Aug 11, 2017 2:25 am
Reputation: 32
Gender: None specified

Re: Daily analysis from FXOpen

Postby whiteking » Thu Apr 13, 2023 1:49 pm

Fundamental Analysis on April 13: USDCAD Is Approaching an Important Support Level
Image

A short digest of the fresh and saturated news background:

- Inflation in the US coincided with analysts' expectations. Core CPI was 5.6% in annual terms. The main problem for suppressing inflation is the rise in prices for energy resources (oil has updated the maximum of the year). According to Bloomberg, the union of Russia and Saudi Arabia in the oil market can create problems in this regard.

- Minutes of the Fed meeting showed that officials expect a mild recession.

- The ECB believes that inflation has become more extensive in Europe, but the lion's share of increases is already behind.

- The Bank of Canada left the rate unchanged at 4.5%, expecting a fall in inflation, but is ready for further increases if necessary.

Reacting to the above and other important news, the US dollar index fell to the lows of the year on the foreign exchange market. Accordingly, the euro, pound and Canadian dollar strengthened. The latter forms a pattern that attracts attention.

On the USDCAD chart, we can observe a narrowing triangle (1-2), indicating the balance of supply and demand. The breakdown of the (3) triangle in March turned out to be false. By its behaviour, the market suggests that the true exit from the triangle will take place in a bearish direction. And this could be the beginning of a long-term downtrend.

Image

This forecast represents FXOpen Companies’ opinion only, it should not be construed as an offer, invitation, or recommendation with respect to FXOpen Companies’ products and services or as financial advice.
I trade at FXOpen

User avatar
whiteking
rank: 150+ posts
rank: 150+ posts
Posts: 350
Joined: Fri Aug 11, 2017 2:25 am
Reputation: 32
Gender: None specified

Re: Daily analysis from FXOpen

Postby whiteking » Fri Apr 14, 2023 2:08 pm

Technical Analysis on April 14, 2023: Gold Price Inches Higher While WTI Crude Oil Aims Fresh Increase

Image

Gold price is rising and trading above the $2,030 resistance. WTI is consolidating and might aim for a fresh increase above $83.25.

Important Takeaways for Gold and Oil
  • Gold price started a fresh increase above the $2,020 resistance against the US Dollar.
  • A key bullish trend line is forming with support near $2,030 on the hourly chart of gold at FXOpen.
  • Crude oil price also gained pace and was able to climb above the $82.00 resistance.
  • There is a key contracting triangle forming with support near $82.00 on the hourly chart of XTI/USD at FXOpen.

Gold Price Technical Analysis

On the hourly chart of gold at FXOpen, the price formed a base above the $1,990 support zone against the US Dollar. The price started a decent increase and was able to clear the $2,000 resistance zone.

Image

The upward move gained pace above the $2,020 and $2,030 resistance levels. Finally, the bears appeared near $2,050. A high is formed at $2,048, and the price is now consolidating gains.

Initial support on the downside is near the 23.6% Fib retracement level of the recent increase from the $2,001 swing low to the $2,048 high. The first major support is forming near a key bullish trend line at $2,030.

If there is a downside break below the trend line, the price might slide toward the 50-hour simple moving average at $2,025. The next major support is near the 61.8% Fib retracement level of the recent increase from the $2,001 swing low to the $2,048 high at $2,020.

On the upside, the bulls are facing resistance near $2,048. An upside break above the $2,048 resistance could send the price toward $2,060. Any more gains may perhaps set the pace for an increase toward the $2,080 level.

Disclaimer: CFDs are complex instruments and come with a high risk of losing your money.
I trade at FXOpen

Please add www.kreslik.com to your ad blocker white list.
Thank you for your support.

User avatar
whiteking
rank: 150+ posts
rank: 150+ posts
Posts: 350
Joined: Fri Aug 11, 2017 2:25 am
Reputation: 32
Gender: None specified

Re: Daily analysis from FXOpen

Postby whiteking » Mon Apr 17, 2023 1:49 pm

Technical Analysis on April 17, 2023: GBP/USD Corrects Gains While USD/CAD Eyes Recovery

Image

GBP/USD faced resistance near 1.2540 and started a downside correction. USD/CAD is recovering and might gain pace if it clears the 1.3370 resistance.

Important Takeaways for GBP/USD and USD/CAD
  • The British Pound started a downside correction below the 1.2500 zone.
  • There was a break below a key bullish trend line with support at 1.2455 on the hourly chart of GBP/USD at FXOpen.
  • USD/CAD declined below the 1.3450 and 1.3400 support levels.
  • A major bearish trend line is forming with resistance near 1.3370 on the hourly chart at FXOpen.

GBP/USD Technical Analysis

On the hourly chart of GBP/USD at FXOpen, the pair was able to climb above the 1.2455 resistance zone. However, the bears were active near the 1.2540 zone.

As a result, the pair started a downside correction below a key bullish trend line with support at 1.2455. Finally, it spiked below the 1.2400 support. A low is formed near 1.2383 and the pair is now consolidating losses.

Image

Immediate resistance is forming near the 23.6% Fib retracement level of the downward move from the 1.2545 swing high to the 1.2383 low at 1.2425.

The next resistance is near 1.2455 (the recent breakdown zone). With an upside break above the 1.2455 zone, the pair could rise toward the 50-hour simple moving average at 1.2485. It coincides with the 61.8% Fib retracement level of the downward move from the 1.2545 swing high to the 1.2383 low.

An upside break above the 1.2485 resistance might send the pair toward 1.2540. Any more gains might open the doors for a test of 1.2600.

On the downside, initial support is near the 1.2400 area. The next major support is near the 1.2345 level. If there is a break below 1.2345, the pair could extend its decline. The next key support is near the 1.2300 level. Any more losses might call for a test of the 1.2250 support.

Disclaimer: CFDs are complex instruments and come with a high risk of losing your money.
I trade at FXOpen

User avatar
whiteking
rank: 150+ posts
rank: 150+ posts
Posts: 350
Joined: Fri Aug 11, 2017 2:25 am
Reputation: 32
Gender: None specified

Re: Daily analysis from FXOpen

Postby whiteking » Tue Apr 18, 2023 3:43 pm

Technical Analysis on April 18, 2023: BTCUSD Formed a Bullish Spinning Top Pattern above $29,138
Image

Bitcoin continues its bullish momentum from last week, and after touching a low of $29,138 on April 18, it moved towards a consolidation phase, after which we expect an upward movement to the $30,500-$32,000 range.


Image

The market opened bullish this week. There is a bullish spinning top pattern above the $29,138 handle on the H1 timeframe.

Bitcoin continues to move up in a mild bullish momentum and is now aiming to cross the $30,000 psychological barrier.

Both the STOCH and STOCHRSI are in overbought zones, meaning that a decline in the price is expected in the immediate short term.

Bitcoin continues to range near a new 1-year high in the weekly timeframe.

The relative strength index is at 63.29, indicating a strong demand for Bitcoin and the continuation of the buying pressure in the markets.

Bitcoin is now moving above the 100-hour exponential and 200-hour exponential moving averages.

Most of the major technical indicators are bullish; the targets for the immediate short term are $30,500 and $32,000.

The average true range indicates low market volatility with mild bullish momentum.
  • Bitcoin bullish continuation is seen above $29,138.
  • The RSI remains above 50, indicating a bullish market.
  • The price is now trading above its pivot level of $29,926.
  • The short-term range is mildly bullish.

Some major technical indicators signal that the price may move to $30,500 and $31,500 soon.

[i]Disclaimer: CFDs are complex instruments and come with a high risk of losing your money.
I trade at FXOpen

User avatar
whiteking
rank: 150+ posts
rank: 150+ posts
Posts: 350
Joined: Fri Aug 11, 2017 2:25 am
Reputation: 32
Gender: None specified

Re: Daily analysis from FXOpen

Postby whiteking » Wed Apr 19, 2023 1:26 pm

Technical Analysis on April 19, 2023: EUR/USD Struggles Below 1.1000 While USD/JPY Aims Higher
Image

EUR/USD started a downside correction from the 1.1075 resistance. USD/JPY is rising and might rally further above the 134.30 resistance.

Important Takeaways for EUR/USD and USD/JPY
  • The Euro struggled to stay above 1.1000 and corrected lower.
  • There is a key bearish trend line forming with resistance near 1.0990 on the hourly chart of EUR/USD at FXOpen.
  • USD/JPY is showing a lot of bullish signs above the 133.85 support zone.
  • There is a major bearish trend line forming with resistance near 134.30 on the hourly chart at FXOpen.
EUR/USD Technical Analysis

On the hourly chart of EUR/USD at FXOpen, the pair struggled to clear the 1.1075 resistance. The Euro started a fresh decline below 1.1000 against the US Dollar.

There was a drop below the 1.0935 support but the bulls were active near the 1.0910 support. A low is formed near 1.0909 and the pair is now attempting a fresh increase. There was a break above the 1.0935 level and the 50-hour simple moving average.

Image

It is now facing resistance near a key bearish trend line forming with resistance near 1.0990. The trend line is close to the 50% Fib retracement level of the downward move from the 1.1075 swing high to the 1.0910 low.

The next major resistance is near the 76.4% Fib retracement level of the downward move from the 1.1075 swing high to the 1.0910 low at 1.1035. An upside break above 1.1035 could set the pace for another increase. In the stated case, the pair might visit 1.1075. Any more gains might send the pair towards 1.1150.

If not, EUR/USD might decline again below the 1.0935 support. The first major support is near the 1.0910 level, below which the pair could start a major decline. In the stated case, the pair might dive toward the 1.0835 support zone.

Disclaimer: CFDs are complex instruments and come with a high risk of losing your money.
I trade at FXOpen

User avatar
whiteking
rank: 150+ posts
rank: 150+ posts
Posts: 350
Joined: Fri Aug 11, 2017 2:25 am
Reputation: 32
Gender: None specified

Re: Daily analysis from FXOpen

Postby whiteking » Thu Apr 20, 2023 2:11 pm

ETHUSD Technical Analysis on April 20, 2023: Three Inside Down Pattern Is Below $2,140

Image

Bulls couldn't keep control of the market, and after touching a high of $2,140 on 16 April, the ETH/USD pair declined, touching a low of $1,923 today in the early Asian trading session.

Image

ETHUSD is under bearish pressure after falling below the $2,000 psychological support level as the global investor sentiment appears weak after the Shanghai upgrade.

The three inside down pattern is below the $2,140 handle on the H1 timeframe. It's a bearish pattern, which signifies the end of a bullish phase. Also, there is a bearish harami pattern in the H2 timeframe.

ETH is back under the pivot point, indicating the bearish pressure in the market.

The relative strength index is at 37.74, indicating very weak demand for Ether and a continuation of the selling pressure in the market.

The STOCHRSI is giving an overbought signal, meaning that the price is expected to decline in the short-term range.

We also detected the formation of the bearish harami pattern in both the 30-minute and 1-hour timeframe.

Most of the technical indicators are bearish. Most moving averages are bearish at the current market level of $1,944.

ETH is now trading below the 100-hour simple and 200-hour exponential moving averages.
  • ETH bearish reversal is seen below the $2,140 mark.
  • The short-term range is expected to be strongly bearish.
  • The average true range indicates low market volatility.
ETH Bearish Reversal Is Below $2,140

Image

On the daily chart, ETH is trading just below its pivot level of $1,955 and is moving into a very strong bearish channel. The price is about to break its classic support level of $1,939 and has already broken its Fibonacci resistance level of $1,951; further supports are $1,910 and $1,850.

An Ichimoku bearish crossover between Tenkan and Kijun is formed in the 15-minute timeframe.

The price ranges near the channel's resistance in the 15-minute timeframe, indicating the bearish trend.

The key support levels to watch are $1,845, which is a 38.2% retracement from the 13-week high, and $1,861, which is a 14-day RSI at 50.

The Week Ahead

ETH is correcting lower below $2,000, indicative of the bearish momentum, and is expected to move towards the $1,900 level in the medium-term range in the H1 timeframe.

We see a short-term bearish trend line forming from $2,140 towards the $1,937 level.

There is a minor bearish trend line with the resistance at $1,994, at which the price crosses the 9-day moving average.

The immediate short-term outlook for ETH has turned mildly bearish, the medium-term outlook has turned bearish, and the long-term outlook is neutral in present market conditions.

The resistance zone is at $2,018, which is a pivot point, and at $2,063, which is 14-3 daily raw stochastic at 80.

The weekly outlook is $1,850 with a consolidation zone of $1,900.

This forecast represents FXOpen Companies opinion only, it should not be construed as an offer, invitation or recommendation in respect to FXOpen Companies products and services or as financial advice.
I trade at FXOpen

User avatar
whiteking
rank: 150+ posts
rank: 150+ posts
Posts: 350
Joined: Fri Aug 11, 2017 2:25 am
Reputation: 32
Gender: None specified

Re: Daily analysis from FXOpen

Postby whiteking » Fri Apr 21, 2023 12:55 pm

Technical Analysis on April 21, 2023: AUD/USD and NZD/USD At Risk of More Losses
Image

AUD/USD started a fresh decline from the 0.6770 resistance zone. NZD/USD is also moving lower and might decline below the 0.6150 support.

Important Takeaways for AUD/USD and NZD/USD
  • The Aussie Dollar started a fresh decline below the 0.6740 support against the US Dollar.
  • There is a key bullish trend line forming with support at 0.6715 on the hourly chart of AUD/USD at FXOpen.
  • NZD/USD failed to clear the 0.6220 resistance zone and reacted to the downside.
  • There is a major bearish trend line forming with resistance near 0.6180 on the hourly chart of NZD/USD at FXOpen.

AUD/USD Technical Analysis

On the hourly chart of AUD/USD at FXOpen, the pair faced rejection near 0.6770. The Aussie dollar started a fresh decline and traded below the 0.6740 support against the US Dollar.

There was a move below the 61.8% Fib retracement level of the upward move from the 0.6697 swing low to the 0.6771 high. It is now trading below the 50-hour simple moving average. It seems like there is a major support waiting near a key bullish trend line with support at 0.6715.

Image

The trend line coincides with the 76.4% Fib retracement level of the upward move from the 0.6697 swing low to the 0.6771 high. If there is a downside break below the trend line, the pair could decline toward 0.6690.

The next support could be the 0.6660 level, below which the bears could aim for a test of the 0.6600 zone in the coming days.

On the upside, the AUD/USD pair is facing resistance near the 0.6740 level. The next major resistance is near the 0.6770 level. A close above the 0.6770 level could start another steady increase in the near term. The next major resistance could be 0.6850.

Disclaimer: CFDs are complex instruments and come with a high risk of losing your money.
I trade at FXOpen

Please add www.kreslik.com to your ad blocker white list.
Thank you for your support.


Return to “forex”