Daily analysis from FXOpen

forex live trades, setups, charts

Moderator: moderators

User avatar
whiteking
rank: 150+ posts
rank: 150+ posts
Posts: 350
Joined: Fri Aug 11, 2017 2:25 am
Reputation: 32
Gender: None specified

Re: Daily analysis from FXOpen

Postby whiteking » Thu Feb 23, 2023 3:10 pm

Analisis Teknis EURUSD dan BTCUSD – 23 Februari 2023
Image

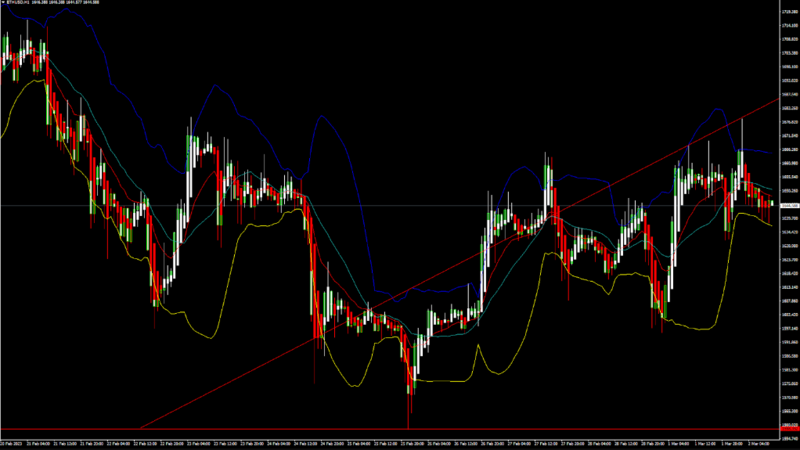
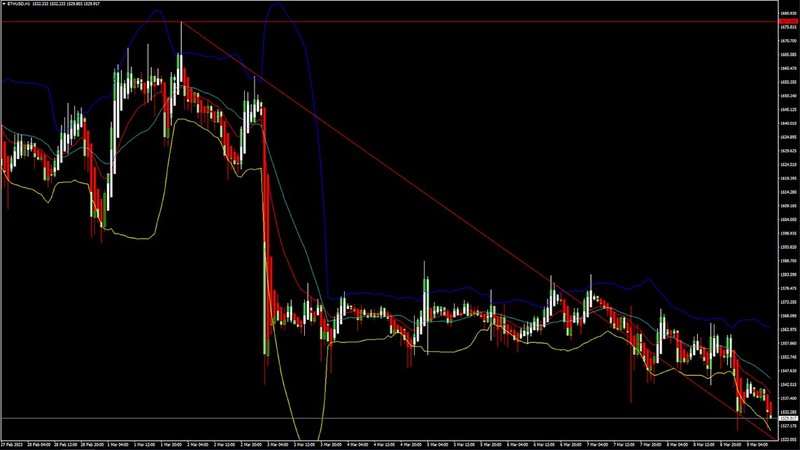
ETHUSD: Pola Palu Di Atas $1596

Ethereum tidak dapat mempertahankan momentum bearishnya dan setelah menyentuh titik terendah 1596 pada 22 Februari, harga mulai terkoreksi ke atas terhadap dolar AS melintasi pegangan $1650 hari ini di sesi perdagangan Eropa.

Kami telah melihat pembukaan pasar yang bullish minggu ini.

Kita dapat dengan jelas melihat pola hammer di atas pegangan $1596 yang merupakan pola bullish dan menandakan akhir dari fase bearish dan dimulainya fase bullish di pasar.

ETH sekarang diperdagangkan tepat di bawah level pivotnya di 1666 dan bergerak ke saluran yang agak bullish. Harga ETHUSD sekarang menguji level resistensi klasiknya di 1669 dan level resistensi Fibonacci di 1671 setelah itu jalur menuju 1700 akan dibersihkan.

Indeks kekuatan relatif berada di 61,93 menunjukkan permintaan yang kuat untuk Ether dan berlanjutnya fase bullish di pasar.

Kita bisa melihat pembentukan garis bullish engulfing pada time frame daily.

Baik STOCH maupun STOCHRSI mengindikasikan pasar overbought, yang berarti harga diperkirakan akan turun dalam kisaran jangka pendek.

Sebagian besar indikator teknis memberikan sinyal pasar beli yang kuat.

Sebagian besar rata-rata bergerak memberikan sinyal beli yang kuat, dan kita sekarang melihat level $1700 hingga $1750 dalam kisaran jangka pendek.

ETH sekarang diperdagangkan di atas rata-rata pergerakan sederhana dan eksponensial 100 & 200 jam.
  • Ether: pembalikan bullish terlihat di atas $1596.
  • Kisaran jangka pendek tampaknya sangat bullish.
  • ETH terus berada di atas level $1650.
  • Kisaran sebenarnya rata-rata menunjukkan lebih sedikit volatilitas pasar.
Ether: Bullish Reversal Terlihat Di Atas $1596
Image

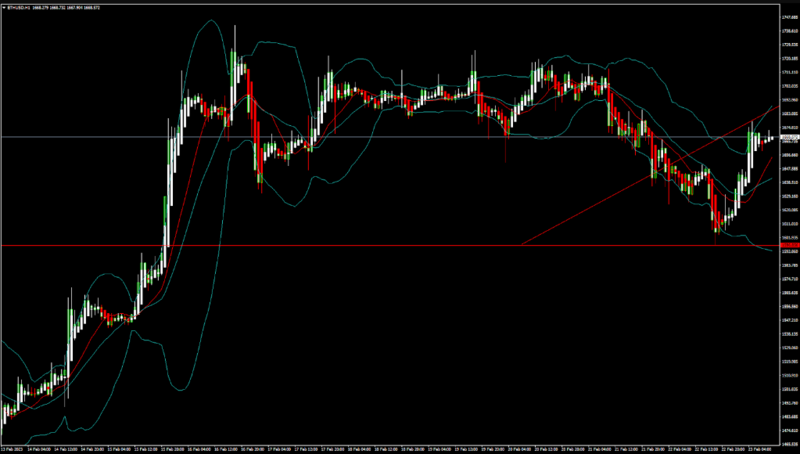
ETHUSD sekarang bergerak dalam saluran yang sangat bullish dengan harga diperdagangkan di atas $1650 di sesi perdagangan Eropa hari ini.

ETH menyentuh intraday low 1637 dan intraday high 1678 di sesi perdagangan Asia hari ini.

Resistensi horizontal ditembus dalam kerangka waktu harian, menunjukkan tren bullish.

MACD memotong rata-rata pergerakannya dalam kerangka waktu 4 jam yang menunjukkan sifat pasar yang bullish.

Ichimoku – crossover bullish: Pola Tenkan dan Kjiun terlihat yang merupakan indikasi bullish pasar.

Harga Ichimoku berada di atas awan dalam kerangka waktu 1 jam menunjukkan skenario bullish.

Indikator Aroon memberikan tren bullish dalam kerangka waktu 15 menit.

Level support utama yang harus diperhatikan adalah $1603 yang merupakan retracement 50% dari tertinggi/terendah 4 minggu, dan $1631 di mana harga melintasi rata-rata pergerakan 9 hari.

ETH telah meningkat sebesar 1,84% dengan perubahan harga sebesar $30,19 dalam 24 jam terakhir dan memiliki volume perdagangan sebesar 8,818 miliar USD.

Kami dapat melihat peningkatan sebesar 1,15% dalam total volume perdagangan dalam 24 jam terakhir yang tampaknya normal.

Minggu Depan

Harga ETH terus berada di zona bullish terhadap dolar AS dan bitcoin. ETHUSD diperkirakan akan bergerak lebih tinggi menuju level $1700 dan $1800 minggu ini.

Di sisi atas, kita sekarang melihat target terdekat di 1724 yang merupakan titik pivot level resistance ke-3, dan 1741 yang merupakan level tertinggi 13 minggu.

Prospek jangka pendek langsung untuk Ether telah berubah menjadi sangat bullish, prospek jangka menengah telah berubah menjadi bullish, dan prospek jangka panjang untuk Ether netral dalam kondisi pasar saat ini.

Harga ETHUSD harus tetap di atas level dukungan penting $1628 yang merupakan titik pivot.

Prospek mingguan diproyeksikan pada $1800 dengan zona konsolidasi $1750.

Penafian: CFD adalah instrumen yang kompleks dan memiliki risiko tinggi kehilangan uang Anda.
I trade at FXOpen

Please add www.kreslik.com to your ad blocker white list.
Thank you for your support.

User avatar
whiteking
rank: 150+ posts
rank: 150+ posts
Posts: 350
Joined: Fri Aug 11, 2017 2:25 am
Reputation: 32
Gender: None specified

Re: Daily analysis from FXOpen

Postby whiteking » Fri Feb 24, 2023 6:49 am

Gold Price Faces Hurdles And Crude Oil Price Could Recover Steadily
Image

Gold price declined from the $1,850 resistance zone. Crude oil price is attempting a recovery wave above the $75.50 resistance zone.

Important Takeaways for Gold and Oil
  • Gold price started a strong decline below the $1,832 level against the US Dollar.
  • A key bearish trend line is forming with resistance near $1,835 on the hourly chart of gold.
  • Crude oil price started a fresh increase from the $73.75 support zone.
  • There was a break above a major bearish trend line with resistance near $75.70 on the hourly chart of XTI/USD.
Gold Price Technical Analysis
Gold price struggled to clear the $1,850 resistance against the US Dollar. The price started a strong decline and traded below the $1,832 support zone.

The bears even pushed the price below $1,825 and the 50 hourly simple moving average. The price traded below the $1,820 level. A low is formed near $1,817 on FXOpen and the price is now consolidating losses. On the upside, an immediate resistance is near the $1,828 level or the 50 hourly simple moving average.

Image
Gold Price Hourly Chart
The stated level is near the 38.2% Fib retracement level of the downward move from the $1,846 swing high to $1,817 low. The next key hurdle is near the $1,832 level.

There is also a key bearish trend line is forming with resistance near $1,835 on the hourly chart of gold. The trend line is near the 50% Fib retracement level of the downward move from the $1,846 swing high to $1,817 low.

A clear upside break above the $1,835 resistance could send the price towards $1,850. If there is no upside break, the price might correct lower.

An immediate support on the downside is near the $1,820 level. The next major support is near the $1,812 level, below which there is a risk of a larger decline. In the stated case, the price could decline sharply towards the $1,800 support zone.

Disclaimer: CFDs are complex instruments and come with a high risk of losing your money.
I trade at FXOpen

User avatar
whiteking
rank: 150+ posts
rank: 150+ posts
Posts: 350
Joined: Fri Aug 11, 2017 2:25 am
Reputation: 32
Gender: None specified

Re: Daily analysis from FXOpen

Postby whiteking » Mon Feb 27, 2023 5:46 am

GBP/USD Declines Heavily While EUR/GBP Attempts Recovery
Image

GBP/USD started a fresh decline below the 1.2200 support zone. EUR/GBP is rising and trading above the 0.8920 support zone.

Important Takeaways for GBP/USD and EUR/GBP
  • The British Pound started a fresh decline from the 1.2150 resistance against the US Dollar.
  • There is a major bearish trend line forming with resistance near 1.2000 on the hourly chart of GBP/USD.
  • EUR/GBP found support near 0.8780 and is currently recovering higher.
  • There is a key bullish trend line forming with support near 0.8805 on the hourly chart.

[size=140]GBP/USD Technical Analysis

The British Pound started a major decline from the 1.2150 resistance zone against the US Dollar. The GBP/USD pair gained pace below the 1.2050 level to move into a bearish zone.

There was a clear move below the 1.2000 level and the 50 hourly simple moving average. The bears even pumped the price below the 1.1950 level and a low is formed near 1.1928 on FXOpen. It is now consolidating losses and trading below the 1.2000 level.

Image
GBP/USD Hourly Chart

On the upside, an initial resistance is near the 1.1985 level. It is near the 50% Fib retracement level of the downward move from the 1.2041 swing high to 1.1928 low.

The first major resistance is near the 1.2000 level. There is also a major bearish trend line forming with resistance near 1.2000 on the hourly chart of GBP/USD. The trend line is near the 61.8% Fib retracement level of the downward move from the 1.2041 swing high to 1.1928 low.

A clear move above the 1.2000 level could spark a decent increase. The next major resistance sits near the 1.2020 level. Any more gains might send the pair towards the 1.2100 resistance zone.

On the downside, an initial support is near the 1.1925 level. The next major support is near the 1.1880 level. Any more losses could lead the pair towards the 1.1800 support zone.

Disclaimer: CFDs are complex instruments and come with a high risk of losing your money.
I trade at FXOpen

User avatar
whiteking
rank: 150+ posts
rank: 150+ posts
Posts: 350
Joined: Fri Aug 11, 2017 2:25 am
Reputation: 32
Gender: None specified

Re: Daily analysis from FXOpen

Postby whiteking » Wed Mar 01, 2023 7:01 am

EUR/USD Eyes Recovery While USD/JPY Remains In Uptrend
Image

EUR/USD is correcting higher from the 1.0520 zone. USD/JPY is also rising and might rally further above the 137.00 resistance.

Important Takeaways for EUR/USD and USD/JPY
  • The Euro started an upside correction above the 1.0550 resistance zone.
  • There was a break above a key bearish trend line with resistance near 1.0570 on the hourly chart of EUR/USD.
  • USD/JPY is showing a lot of bullish signs above the 135.80 support zone.
  • There is a major bullish trend line forming with support near 135.80 on the hourly chart.
EUR/USD Technical Analysis

This past week, the Euro saw bearish moves below the 1.0600 support against the US Dollar. The EUR/USD pair even broke the 1.0580 support zone.

The pair gained pace below the 1.0550 support zone and traded as low as 1.0532 on FXOpen. The pair started an upside correction and traded above the 1.0550 resistance. There was a clear move above the 1.0580 level.

Image
EUR/USD Hourly Chart

Besides, there was a break above a key bearish trend line with resistance near 1.0570 on the hourly chart of EUR/USD. A high was formed near 1.0645 and the pair started a fresh decline. There was a clear move below the 1.0600 support zone, but the pair stayed above the 50 hourly simple moving average.

There was a spike below the 61.8% Fib retracement level of the upward move from the 1.0532 swing low to 1.0645 high. It is now consolidating near the 1.0590 level.

On the upside, an immediate resistance is near the 1.0600 level. The next major resistance is near the 1.0640 level. An upside break above 1.0640 could set the pace for another increase. In the stated case, the pair might visit 1.0700.

Any more gains might send the pair towards 1.0750. If not, it could continue to move down. An initial support on the downside is near the 1.0570 level. The first major support is near the 1.0550 level.

The main support sits near the 1.0535 zone, below which the pair could start a major decline. In the stated case, the pair might dive towards the 1.0450 support zone.

Disclaimer: CFDs are complex instruments and come with a high risk of losing your money.
I trade at FXOpen

User avatar
whiteking
rank: 150+ posts
rank: 150+ posts
Posts: 350
Joined: Fri Aug 11, 2017 2:25 am
Reputation: 32
Gender: None specified

Re: Daily analysis from FXOpen

Postby whiteking » Thu Mar 02, 2023 2:18 pm

ETHUSD and LTCUSD Technical Analysis – 02nd MAR, 2023

Image

ETHUSD: Three White Soldiers Pattern Above $1558

Ethereum was unable to sustain its bearish momentum and after touching a low of $1558 on 25th Feb, the prices started to correct upwards against the US dollar ranging above the $1640 handle today in the Asian trading session.

The prices of Ethereum are ranging near a new record high of 1 month.

The price of ETHUSD is back over the pivot point in the weekly time frame indicating a bullish scenario.

We can clearly see a three white soldiers pattern above the $1558 handle which is a bullish pattern and signifies the end of a bearish phase and the start of a bullish phase in the markets.

ETH is now trading just above its pivot level of 1645 and moving into a mildly bullish channel. The price of ETHUSD is now testing its classic resistance level of 1650 and Fibonacci resistance level of 1656 after which the path towards 1700 will get cleared.

We can see the formation of the bullish harami pattern in the weekly timeframe.

The relative strength index is at 52.40 indicating a neutral demand for Ether and a shift towards the consolidation phase in the markets.

The commodity channel index, CCI, is giving a neutral signal, which means that the prices are expected to remain in a consolidation phase.

Some of the technical indicators are giving a buy market signal.

Most of the moving averages are giving a buy signal at the current market level of $1645.

ETH is now trading above both the 100 hourly simple and 100 hourly exponential moving averages.
  • Ether: bullish reversal seen above the $1558 mark.
  • The short-term range appears to be mildly bullish.
  • ETH continues to remain above the $1640 level.
  • The average true range is indicating less market volatility.
Ether: Bullish Reversal Seen Above $1558
Image

ETHUSD continues to consolidate its gains and is now moving above the $1600 handle with an upside focus of $1700 and $1800 levels.

We can see the formation of the bullish trend reversal pattern with moving averages MA20 in the daily time frame.

The resistance of the channel is broken in the 15-minute time frame indicating a bullish outlook present in the markets.

ETHUSD touched an intraday high of 1677 in the Asian trading session and an intraday low of 1638 in the London trading session today.

The key support levels to watch are $1593 which is a 14-day RSI at 40%, and at $1637 at which the price crosses 18-day moving average stalls.

ETH has decreased by 0.73% with a price change of 12.10$ in the past 24hrs and has a trading volume of 6.909 billion USD.

We can see a decrease of 11.89% in the total trading volume in the last 24 hrs which is due to the market consolidation.

The Week Ahead

ETH has retracted after touching a high of $1677, and after this consolidation phase gets over, we are looking to cross the $1700 handle.

We can see the formation of a bullish ascending channel from $1558 towards the $1691 level.

The immediate short-term outlook for Ether has turned mildly bullish, the medium-term outlook has turned bullish, and the long-term outlook for Ether is neutral in present market conditions.

The resistance zone is located at $1686 which is a 14-3 day raw stochastic at 80% and at $1694 at which the price crosses 9-day moving average stalls.

The weekly outlook is projected at $1750 with a consolidation zone of $1700.

Disclaimer: CFDs are complex instruments and come with a high risk of losing your money.
I trade at FXOpen

Please add www.kreslik.com to your ad blocker white list.
Thank you for your support.

User avatar
whiteking
rank: 150+ posts
rank: 150+ posts
Posts: 350
Joined: Fri Aug 11, 2017 2:25 am
Reputation: 32
Gender: None specified

Re: Daily analysis from FXOpen

Postby whiteking » Mon Mar 06, 2023 5:37 am

GBP/USD Starts Recovery While USD/CAD Faces Key Resistance
Image

GBP/USD is correcting losses and trading above the 1.2000 zone. USD/CAD is struggling to clear the 1.3650 resistance zone.


Important Takeaways for GBP/USD and USD/CAD
  • The British Pound started a decent recovery wave above the 1.2000 resistance zone.
  • There was a break above a key bearish trend line with resistance near 1.1965 on the hourly chart of GBP/USD.
  • USD/CAD is struggling below the 1.3640 and 1.3650 support levels.
  • There is a major bearish trend line forming with resistance near 1.3640 on the hourly chart.
GBP/USD Technical Analysis

The British Pound started a fresh decline from well above 1.2120 against the US Dollar. The GBP/USD pair gained bearish momentum after there was a break below the 1.2050 support.

The pair even broke the 1.2000 support level and the 50 hourly simple moving average. The recent swing high was formed near 1.1925 on FXOpen before the price started an upside correction. There was a move above the 1.1980 level.

Image
GBP/USD Hourly Chart

There was a break above a key bearish trend line with resistance near 1.1965 on the hourly chart of GBP/USD. Besides, there was a move above the 50% Fib retracement level of the downward move from the 1.2142 swing high to 1.1925 low.

An immediate resistance is near the 1.2050 level. It is near the 61.8% Fib retracement level of the downward move from the 1.2142 swing high to 1.1925 low.

The next major resistance is near the 1.2080 level. Any more gains could lead the pair towards the 1.2120 barrier in the near term. If not, the pair could move down and might break the 1.2000 support. The next major support is near 1.1980.

If there is a downside break, GBP/USD might test the 1.1920 support. The next major support sits at 1.1850, where the bulls might take a stand.

Disclaimer: This Publication represents FXOpen Companies opinion only, it should not be construed as an offer, invitation or recommendation in respect to FXOpen Companies products and services or as Financial Advice.
I trade at FXOpen

User avatar
whiteking
rank: 150+ posts
rank: 150+ posts
Posts: 350
Joined: Fri Aug 11, 2017 2:25 am
Reputation: 32
Gender: None specified

Re: Daily analysis from FXOpen

Postby whiteking » Tue Mar 07, 2023 4:11 pm

BTCUSD and XRPUSD Technical Analysis – 07th MAR 2023
Image

BTCUSD: Evening Star Pattern Below $23963

Bitcoin was unable to sustain its bullish momentum last week and after touching a high of $23963 on 01st March, the prices started to correct downwards against the US dollar, touching a low of $22048 on 03rd March.

We have seen a bearish opening of the markets this week.

We can clearly see an evening star pattern below the $23963 handle which is a bearish reversal pattern because it signifies the end of an uptrend and a shift towards a downtrend.

Bitcoin touched an intraday high of 22544 in the Asian trading session, and an intraday low of 23370 in the European trading session today.

The momentum indicator is back under zero in the 4-hour time frame indicating bearish trends.

The price of bitcoin is ranging near a new record low of 1 month.

Both the STOCH and Williams percent range are indicating overbought levels which means that in the immediate short term, a decline in the prices is expected.

We can see the formation of bearish engulfing lines in the 1-hour time frame.

The relative strength index is at 43.75 indicating a weak demand for bitcoin, and the continuation of the selling pressure in the markets.

Bitcoin is now moving below its 100 hourly simple moving average and below its 100 hourly exponential moving averages.

Most of the major technical indicators are giving a sell signal, which means that in the immediate short term, we are expecting targets of 22000 and 21500.

The average true range is indicating less market volatility with a bearish momentum.
  • Bitcoin: bearish reversal seen below $23963.
  • The STOCHRSI is indicating an oversold market.
  • The price is now trading just below its pivot level of $22414.
  • The short-term range is mildly bearish.

Bitcoin: Bearish Reversal Seen Below $23963
Image

The price of bitcoin is now moving in a consolidation channel above the $22000 handle after which fresh declines could be expected, or we can see some market correction upwards if the demand for bitcoin increases in the global markets.

Some of the technical indicators are also giving a neutral tone present in the markets.

We can see the formation of a bearish price crossover pattern with the adaptive moving average, AMA 50, in the 30-minute time frame.

The price of bitcoin is ranging near the resistance of the channel indicating a bearish trend present in the markets.

The immediate short-term outlook for bitcoin is strongly bearish, the medium-term outlook has turned bearish, and the long-term outlook remains neutral under present market conditions.

Bitcoin’s support zone is located at $21780 which is a 3-10 day MACD oscillator stalls, and at $21851 at which the price crosses 18-day moving average stalls.

The price of BTCUSD is now facing its classic support level of 22376 and Fibonacci support level of 22404 after which the path towards 22000 will get cleared.

In the last 24hrs, BTCUSD has increased by 0.03% by 5.75$ and has a 24hr trading volume of USD 15.799 billion. We can see an increase of 1208% in the trading volume compared to yesterday, which appears to be normal.

The Week Ahead

We can see that the price of Bitcoin has resumed its downtrend, which may extend to $21500 after which we may see some correction and change in the trend present in the markets.

There is a descending channel forming with the current support located at $20785 which is a 50% retracement from a 13-week high/low.

The daily RSI is printing at 43.26 which indicates a weak demand for bitcoin and the continuation of the bearish phase present in the markets in the short-term range.

We can see the formation of a bearish trendline from $23963 towards the $22141 level.

The price of BTCUSD is now facing its resistance zone located at $22695 which is a 14-3 day raw stochastic at 20% and at $22774 which is a 14-day RSI at 50%

The weekly outlook is projected at $21500 with a consolidation zone of $22000.

Disclaimer: This Publication represents FXOpen Companies opinion only, it should not be construed as an offer, invitation or recommendation in respect to FXOpen Companies products and services or as Financial Advice.
I trade at FXOpen

User avatar
whiteking
rank: 150+ posts
rank: 150+ posts
Posts: 350
Joined: Fri Aug 11, 2017 2:25 am
Reputation: 32
Gender: None specified

Re: Daily analysis from FXOpen

Postby whiteking » Wed Mar 08, 2023 7:44 am

EUR/USD Gains Bearish Momentum While USD/CHF Extends Rally
Image

EUR/USD started a major decline below the 1.0620 level. USD/CHF is rising and might aim more gains above the 0.9450 resistance.

Important Takeaways for EUR/USD and USD/CHF
  • The Euro started a fresh decline from the 1.0700 resistance against the US Dollar.
  • There was a break below a key bullish trend line with support near 1.0620 on the hourly chart of EUR/USD.
  • USD/CHF started a fresh increase above the 0.9350 resistance zone.
  • There was a break above a major bearish trend line with resistance near 0.9315 on the hourly chart.

EUR/USD Technical Analysis

After struggling to clear the 1.0700 resistance, the Euro started a fresh decline against the US Dollar. The EUR/USD pair traded below the 1.0620 support zone to enter a bearish zone.

The pair even declined below the 1.0600 level above the 50 hourly simple moving average. There was also a break below a key bullish trend line with support near 1.0620 on the hourly chart of EUR/USD. The decline gained pace below the 1.0580 level.

Image
EUR/USD Hourly Chart

A low is formed near 1.0531 on FXOpen and the pair is now showing a lot of bearish signs. An immediate resistance is near the 1.0570 level. It is near the 23.6% Fib retracement level of the downward move from the 1.0694 swing high to 1.0531 low.

The next major resistance is near the 1.0610 level. It is near the 50% Fib retracement level of the downward move from the 1.0694 swing high to 1.0531 low.

A clear move above the 1.0610 resistance zone could send the pair further higher. Any more gains might open the doors for a move towards the 1.0650 level. If there is no recovery, the pair might continue to move down below the 1.0530 level.

On the downside, an immediate support is near the 1.0520 level. The next major support is near the 1.0500 level. A downside break below the 1.0500 support could start steady decline towards the 1.0450 level.

Disclaimer: This Publication represents FXOpen Companies opinion only, it should not be construed as an offer, invitation or recommendation in respect to FXOpen Companies products and services or as Financial Advice.
I trade at FXOpen

User avatar
whiteking
rank: 150+ posts
rank: 150+ posts
Posts: 350
Joined: Fri Aug 11, 2017 2:25 am
Reputation: 32
Gender: None specified

Re: Daily analysis from FXOpen

Postby whiteking » Thu Mar 09, 2023 3:43 pm

ETHUSD and LTCUSD Technical Analysis – 09th MAR, 2023
Image

ETHUSD: Bearish Engulfing Pattern Below $1677

Ethereum was unable to sustain its bullish momentum and after touching a high of $1677 on 02nd Mar, the price started to decline against the US dollar trading below the $1550 handle today in the European trading session.

We have seen a bearish opening of the markets this week.

The price of ETHUSD is ranging near a new record low of 1 month.

We can clearly see a bearish engulfing pattern below the $1677 handle which is a bearish pattern and signifies the end of a bullish phase and the start of a bearish phase in the markets.

ETH is now trading just below its pivot levels of 1537 and moving in a mildly bearish channel. The price of ETHUSD is now testing its classic support level of 1530 and Fibonacci support level of 1536 after which the path towards 1500 will get cleared.

We can see the formation of a black hanging man in the 4-hour time frame indicating a neutral tone of the markets.

The relative strength index is at 40.95 indicating a weak demand for Ether and a shift towards the consolidation phase in the markets.

The commodity channel index, CCI, is giving an oversold signal, which means that the price is expected to correct upwards in the short-term range.

Most of the technical indicators are giving a sell market signal.

Most of the moving averages are giving a sell signal at the current market level of $1531.

ETH is now trading below both its 100 hourly simple and 100 hourly exponential moving averages.
  • Ether: bearish reversal seen below the $1677 mark.
  • The short-term range appears to be mildly bearish.
  • ETH continues to remain below the $1550 level.
  • The average true range is indicating less market volatility.
Ether: Bearish Reversal Seen Below $1677
Image

ETHUSD continues to weaken and we can see a move towards the consolidation phase in the markets. Now the next visible targets are located at $1500 and $1450.

We can see the formation of the three black crows pattern in the 2-hour time frame indicating bearish trends.

The MACD crosses down its moving average in the 30-minute time frame indicating the bearish nature of the market.

ETHUSD touched an intraday high of 1552 in the Asian trading session and an intraday low of 1528 in the London trading session today.

The key support levels to watch are $1446 which is a 50% retracement from a 13 week high/low, and $1486 at which the price crosses 18-day moving average stalls.

ETH has decreased by 1.27% with a price change of 19.71$ in the past 24hrs and has a trading volume of 7.237 billion USD.

We can see a decrease of 0.87% in the total trading volume in the last 24 hrs which appears to be normal.

The Week Ahead

ETH was unable to cross the $1700 handle last week and now we are about to touch the $1500 level. If the demand for Ethereum increases we could witness a bounce in the levels next week.

We can see the formation of a bearish ascending channel from $1677 towards the $1522 level.

The immediate short-term outlook for Ether has turned mildly bearish, the medium-term outlook has turned bearish, and the long-term outlook for Ether is neutral in present market conditions.

The resistance zone is located at $1575 which is a 14-3 day raw stochastic at 20% and at $1586 which is a 14-day RSI at 50%.

The weekly outlook is projected at $1450 with a consolidation zone of $1500.

Disclaimer: This Publication represents FXOpen Companies opinion only, it should not be construed as an offer, invitation or recommendation in respect to FXOpen Companies products and services or as Financial Advice.
I trade at FXOpen

User avatar
whiteking
rank: 150+ posts
rank: 150+ posts
Posts: 350
Joined: Fri Aug 11, 2017 2:25 am
Reputation: 32
Gender: None specified

Re: Daily analysis from FXOpen

Postby whiteking » Fri Mar 10, 2023 6:42 am

Gold Price Recovers While Crude Oil Price Declines Further
Image

Gold price is attempting a recovery wave above the $1,820 resistance. Crude oil prices are declining and remain at a risk of more losses below $75.

Important Takeaways for Gold and Oil
  • Gold price started a recovery wave above the $1,820 resistance against the US Dollar.
  • A key bearish trend line is forming with resistance near $1,832 on the hourly chart of gold.
  • Crude oil price started a fresh decline below the $80 support zone.
  • There is a major bearish trend line forming with resistance near $76.65 on the hourly chart of XTI/USD.
Gold Price Technical Analysis

Gold price formed a base above the $1,810 support zone against the US Dollar. The price started a decent increase and was able to clear the $1,820 resistance zone.

The bulls were able to push the price above the 38.2% Fib retracement level of the downward move from the $1,858 swing high to $1,809 low (formed on FXOpen). The price is now trading above the $1,820 level and the 50 hourly simple moving average.

Image
Gold Price Hourly Chart

It is now facing resistance near the $1,835 zone. There is also a key bearish trend line forming a resistance near $1,832 on the hourly chart of gold.

The trend line is near the 50% Fib retracement level of the downward move from the $1,858 swing high to $1,809 low. The next key hurdle is near the $1,840 level.

A clear upside break above the $1,840 resistance could send the price towards $1,850. If there is no upside break, the price might correct lower.

An immediate support on the downside is near the $1,820 level. The next major support is near the $1,810 level, below which there is a risk of a larger

Disclaimer: This Publication represents FXOpen Companies opinion only, it should not be construed as an offer, invitation or recommendation in respect to FXOpen Companies products and services or as Financial Advice.
I trade at FXOpen

Please add www.kreslik.com to your ad blocker white list.
Thank you for your support.


Return to “forex”