Daily analysis from FXOpen

forex live trades, setups, charts

Moderator: moderators

User avatar
whiteking
rank: 150+ posts
rank: 150+ posts
Posts: 350
Joined: Fri Aug 11, 2017 2:25 am
Reputation: 32
Gender: None specified

Re: Daily analysis from FXOpen

Postby whiteking » Thu Feb 09, 2023 2:59 pm

#MarketNews #Gold

#MarketNew #Gas

NATURAL GAS PRICES ARE NEARING NEW LOWS OF THE YEAR

The approaching spring after a warm winter, increased supply amid geopolitical risks that are losing influence — all this has led to the fact that natural gas futures prices are around $2.37 per contract, the lowest level since December 2020.

The Energy Information Administration (EIA) sharply lowered its forecast for US natural gas prices this week. According to the forecast, prices in 2023 are likely to average $3.40 (30% below the forecast published 1 month ago). For 2024, the EIA cut its natural gas price forecast by 15.8% to $4.04.

The current price is well below the forecasts, but the downtrend is still in place. Please note that trading volumes show high values, which indicates the activity of large market participants; they may be accumulating a long position in the expectation that prices will rise to the average forecast values in the long term.

Image

CFDs are complex instruments and come with a high risk of losing your money.

This forecast represents FXOpen Companies opinion only, it should not be construed as an offer, invitation or recommendation in respect to FXOpen Companies products and services or as financial advice.


Source FXOpen Telegram channel
I trade at FXOpen

Please add www.kreslik.com to your ad blocker white list.
Thank you for your support.

User avatar
whiteking
rank: 150+ posts
rank: 150+ posts
Posts: 350
Joined: Fri Aug 11, 2017 2:25 am
Reputation: 32
Gender: None specified

Re: Daily analysis from FXOpen

Postby whiteking » Fri Feb 10, 2023 6:53 am

size=150]Gold Price Turns Red And Crude Oil Price Could Correct Gains[/size]
Image

Gold price is moving lower and trading below $1,880. Crude oil price is facing a strong resistance near the $79 zone and might correct lower.

Important Takeaways for Gold and Oil
  • Gold price started a strong decline below the $1,900 level against the US Dollar.
  • It traded below a key rising channel with support near $1,872 on the hourly chart of gold.
  • Crude oil price started a fresh increase from the $72.50 support zone.
  • There is a connecting trend line forming with resistance near $79.10 on the hourly chart of XTI/USD.

Gold Price Technical Analysis

Gold price struggled to stay above the $1,950 level against the US Dollar. The price started a strong decline and traded below the $1,920 support zone.

The bears even pushed the price below $1,900 and the 50 hourly simple moving average. Recently, there was a break below a key rising channel with support near $1,872 on the hourly chart of gold. The price traded below the $1,865 level.

Image
Gold Price Hourly Chart

A low is formed near $1,859 on FXOpen and the price is now consolidating losses. On the upside, an immediate resistance is near the $1,870 level.

The stated level is near the 23.6% Fib retracement level of the downward move from the $1,890 swing high to $1,859 low. The next key hurdle is near the $1,875 level or the 50 hourly simple moving average.

The 50% Fib retracement level of the downward move from the $1,890 swing high to $1,859 low is also near the $1,875 level. A clear upside break above the $1,875 resistance could send the price towards $1,890.

An immediate support on the downside is near the $1,858 level. The next major support is near the $1,850 level, below which there is a risk of a larger decline. In the stated case, the price could decline sharply towards the $1,832 support zone.

Disclaimer: CFDs are complex instruments and come with a high risk of losing your money.
I trade at FXOpen

User avatar
whiteking
rank: 150+ posts
rank: 150+ posts
Posts: 350
Joined: Fri Aug 11, 2017 2:25 am
Reputation: 32
Gender: None specified

Re: Daily analysis from FXOpen

Postby whiteking » Mon Feb 13, 2023 5:32 am

GBP/USD Could Extend Losses, USD/CAD Breaks Key Support
Image

GBP/USD is showing bearish signs below the 1.2150 resistance. USD/CAD traded below the 1.3400 support, which might now act as a resistance.

Important Takeaways for GBP/USD and USD/CAD
  • The British Pound started a fresh decline from the 1.2200 resistance zone.
  • There is a key bearish trend line forming with resistance near 1.2065 on the hourly chart of GBP/USD.
  • USD/CAD is struggling below the 1.3420 and 1.3400 support levels.
  • There was a break below a connecting bullish trend line with support near 1.3380 on the hourly chart.

GBP/USD Technical Analysis

The British Pound started a fresh decline from well above 1.2400 against the US Dollar. The GBP/USD pair gained bearish momentum after there was a break below the 1.2250 support.

The pair even broke the 1.2150 support level and the 50 hourly simple moving average. The recent swing high was formed near 1.2193 on FXOpen before the price started another decline. There was a move below the 50% Fib retracement level of the upward move from the 1.1961 swing low to 1.2193 high.

Image
GBP/USD Hourly Chart
It is now trading below 1.2050 and the 50 hourly simple moving average. There is also a key bearish trend line forming with resistance near 1.2065 on the hourly chart of GBP/USD.

An immediate resistance is near the 1.2060 level. The next major resistance is near the 1.2100 level and the 50 hourly simple moving average. Any more gains could lead the pair towards the 1.2200 barrier in the near term.

If not, the pair could continue to move down and might even break the 1.2040 support. The next major support is near 1.2000 or the 76.4% Fib retracement level of the upward move from the 1.1961 swing low to 1.2193 high.

If there is a downside break, GBP/USD might test the 1.1960 support. The next major support sits at 1.1850, where the bulls might take a stand.

Disclaimer: CFDs are complex instruments and come with a high risk of losing your money.
I trade at FXOpen

User avatar
whiteking
rank: 150+ posts
rank: 150+ posts
Posts: 350
Joined: Fri Aug 11, 2017 2:25 am
Reputation: 32
Gender: None specified

Re: Daily analysis from FXOpen

Postby whiteking » Tue Feb 14, 2023 2:20 pm

BTCUSD and XRPUSD Technical Analysis – 14th FEB 2023

Image

BTCUSD: The Evening Star Pattern Below $23432

Bitcoin was unable to sustain its bullish momentum last week and after touching a high of $22432 started to decline against the US dollar, touching a low of $21450 on 13th Feb.

We have seen a bearish opening of the markets this week.

We can clearly see the evening star pattern below the $23432 handle which is a bearish reversal pattern because it signifies the end of an uptrend and a shift towards a downtrend.

Bitcoin touched an intraday high of 21839 in the Asian trading session and an intraday low of 21683 in the European trading session today.

We can see the formation of a three black crows pattern in the weekly time frame indicating bearish trends.

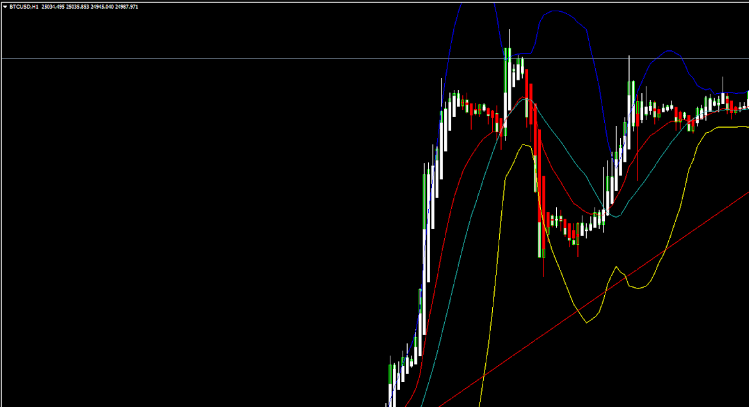
The Ichimoku price is under the cloud in the 2-hour time frame indicating bearish trends.

Both the STOCH and Williams percent range are indicating overbought levels which means that in the immediate short term a decline in the prices is expected.

The RSI indicator is back under 50 in the 2-hour time frame indicating the bearish nature of the markets.

The relative strength index is at 48.77 indicating a NEUTRAL demand for bitcoin, and the shift towards the consolidation phase in the markets.

Bitcoin is now moving below its 100 hourly simple moving average and below its 100 hourly exponential moving averages.

Some of the major technical indicators are giving a SELL signal, which means that in the immediate short term, we are expecting targets of 21000 and 20500.

The average true range is indicating LESS market volatility with a mildly bearish momentum.
  • Bitcoin: bearish reversal seen below $23432.
  • The commodity channel index is indicating a NEUTRAL level.
  • The price is now trading just below its pivot levels of $21764.
  • The short-term range is mildly bearish.

Bitcoin: Bearish Reversal Seen Below $23432
Image

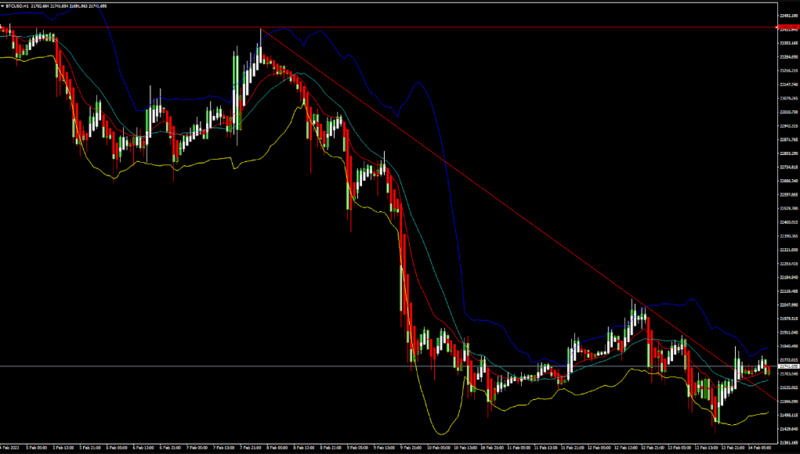
The price of Bitcoin was unable to cross the $24K mark last week, and we can see a continuous fall in the levels now trading below the $22K handle.

As some of the technical indicators are also giving a neutral stance of the markets, we are expecting that a bullish reversal is possible after touching the $20500 level.

We have also detected the formation of bearish engulfing lines in the 30-minute time frame.

The MACD crosses down its moving average in the 15-minute time frame indicating the bearish nature of the markets.

We can see the formation of a bearish price crossover pattern with the adaptive moving average AMA20 in both the 30-minute and 2-hour time frames.

The immediate short-term outlook for bitcoin is mildly bearish, the medium-term outlook has turned bearish, and the long-term outlook remains neutral under present market conditions.

Bitcoin’s support zone is located at $20027 at which the price crosses the 40-day moving average, and at $20937 at which the price crosses the 18-day moving average stalls.

The price of BTCUSD is now facing its classic support level of 21703 and Fibonacci support level of 21502 after which the path towards 21000 will get cleared.

In the last 24hrs BTCUSD has increased by 0.57% by 122.76$ and has a 24hr trading volume of USD 21.364 billion. We can see an increase of 0.42% in the trading volume compared to yesterday, which appears to be normal.

The Week Ahead

Bitcoin is now facing the extended crypto winter due to which the prices are unable to rise above the $25000 level.

We are now heading towards the $21500 level this week.

The daily RSI is printing at 47.08 which indicates a NEUTRAL demand for bitcoin and the continuation of the bearish phase present in the markets in the short-term range.

We can see the formation of a bearish trend line from $23432 towards the $21576 level.

The price of BTCUSD is now facing its support zone located at $20884 which is a 38.2% retracement from a 13-week high.

The weekly outlook is projected at $21000 with a consolidation zone of $20500.

Technical Indicators:

The average directional index (14): It is at 28.57 indicating a SELL.

The ultimate oscillator: It is at 39.72 indicating a SELL.

The rate of price change: It is at -5.67 indicating a SELL.

Bull/bear power (13): It is at -1085.58 indicating a SELL.


Disclaimer: CFDs are complex instruments and come with a high risk of losing your money
I trade at FXOpen

User avatar
whiteking
rank: 150+ posts
rank: 150+ posts
Posts: 350
Joined: Fri Aug 11, 2017 2:25 am
Reputation: 32
Gender: None specified

Re: Daily analysis from FXOpen

Postby whiteking » Wed Feb 15, 2023 6:57 am

EUR/USD Could Extend Losses While USD/CHF Aims Higher
Image

EUR/USD is facing a strong resistance near the 1.0800 zone. USD/CHF is rising and might aim a clear move above the 0.9240 resistance zone.

Important Takeaways for EUR/USD and USD/CHF
  • The Euro started a fresh decline from the 1.0800 resistance against the US Dollar.
  • There is a key bearish trend line forming with resistance near 1.0750 on the hourly chart of EUR/USD.
  • USD/CHF started a fresh increase above the 0.9200 resistance zone.
  • There is a major bearish trend line forming with resistance near 0.9240 on the hourly chart.

EUR/USD Technical Analysis

After testing the 1.0650 support zone, the Euro started a steady increase against the US Dollar. The EUR/USD pair gained pace above the 1.0700 level to move into a bullish zone.

The pair even climbed above the 1.0750 resistance and settled above the 50 hourly simple moving average. However, the bears were active near the 1.0800 resistance. It traded as high as 1.0804 on FXOpen and recently started a downside correction.

Image

EUR/USD Hourly Chart
There was a move below the 1.0750 level. There was a clear move below the 50% Fib retracement level of the upward move from the 1.0655 swing low to 1.0804 high.

It is now trading above 1.0700 and the 50 hourly simple moving average. On the downside, an immediate support is near the 1.0710 level. It is near the 61.8% Fib retracement level of the upward move from the 1.0655 swing low to 1.0804 high.

The next major support is near the 1.0690 level. A downside break below the 1.0690 support could start another decline towards the 1.0650 level.

An immediate resistance is near the 1.0730 level. The next major resistance is near the 1.0750 level. There is also a key bearish trend line forming with resistance near 1.0750 on the hourly chart of EUR/USD.

A clear move above the 1.0750 resistance zone could set the pace for a larger increase towards 1.0800. The next major resistance is near the 1.0850 zone.

Disclaimer: CFDs are complex instruments and come with a high risk of losing your money.
I trade at FXOpen

Please add www.kreslik.com to your ad blocker white list.
Thank you for your support.

User avatar
whiteking
rank: 150+ posts
rank: 150+ posts
Posts: 350
Joined: Fri Aug 11, 2017 2:25 am
Reputation: 32
Gender: None specified

Re: Daily analysis from FXOpen

Postby whiteking » Thu Feb 16, 2023 4:13 pm

ETHUSD and LTCUSD Technical Analysis – 16th FEB, 2023
Image

ETHUSD: Double Bottom Pattern Above $1462

Ethereum was unable to sustain its bearish momentum and after touching a low of $1462 on 13th Feb, the price started to correct upwards against the US dollar now ranging above the $1650 handle today in the Asian trading session.

We can see a continuous escalation in the price of Ethereum which is expected to push up its price above the $1700 handle.

The price of ETH has touched a new record high of 5 months.

We can clearly see a double bottom pattern above the $1462 handle which is a bullish pattern and signifies the end of a bearish phase and the start of a bullish phase in the markets.

ETH is now trading just above its pivot level of 1681 and moving into a strongly bullish channel. The price of ETHUSD is now testing its classic resistance level of 1687 and Fibonacci resistance level of 1693 after which the path towards 1800 will get cleared.

We can see the formation of bullish engulfing lines in the weekly time frame.

The relative strength index is at 75.92 indicating a very strong demand for Ether and the continuation of the buying pressure in the markets.

The RSI is giving an overbought signal, which means that the price is expected to decline in the short-term range.

Most of the technical indicators are giving a STRONG BUY market signal.

Most of the moving averages are giving a STRONG BUY signal at the current market level of $1683.

ETH is now trading above both the 100 hourly simple and 100 hourly exponential moving averages.
  • Ether: bullish reversal seen above the $1462 mark.
  • The short-term range appears to be strongly bullish.
  • ETH continues to remain above the $1650 level.
  • The average true range is indicating LESS market volatility.
Ether: Bullish Reversal Seen Above $1462
Image

ETHUSD has now resumed its bullish trend and we are now expecting a retest of the $1800 level soon after which the next visible targets are located at $1800 and $2000 levels.

We can see the formation of a bullish price crossover pattern with the adaptive moving average AMA20 in the weekly time frame.

We have also detected the formation of a white gravestone/inverted hammer pattern in the daily time frame conforming to the bullish reversal.

ETHUSD touched an intraday high of 1707 and an intraday low of 1664 in the Asian trading session today.

The Aroon indicator is giving a bullish trend in the daily time frame.

The key support levels to watch are $1657 at which the price crosses 9-day moving average stalls, and $1679 which is a 3-10 day MACD oscillator stalls.

ETH has increased by 8.76% with a price change of 135.58$ in the past 24hrs and has a trading volume of 12.329 billion USD.

We can see an increase of 34.47% in the total trading volume in the last 24 hrs which is due to the heavy buying seen at lower levels.

The Week Ahead

ETH has now moved into a breakout zone which is expected to continue this week and now we are heading towards the $1800 level.

At present the prices are moving in a super bullish zone above the $1650 levels.

We can see the formation of a bullish ascending channel from $1462 towards the $1713 level.

The immediate short-term outlook for Ether has turned strongly bullish, the medium-term outlook has turned bullish, and the long-term outlook for Ether is neutral under present market conditions.

The resistance zone is located at $1809 which is a 14-Day RSI at 70%, and at $1842 which is a pivot point 3rd level resistance.

Weekly outlook is projected at $1900 with a consolidation zone of $1850.

Technical Indicators:

The STOCH (9,6): is at 58.99 indicating a BUY.

The moving average convergence divergence (12,26): is at 32.22 indicating a BUY.

The Williams percent range: is at -20.25 indicating a BUY.

The rate of price change: is at 5.77 indicating a BUY.

Cryptocurrency CFDs are not available to retail clients in the UK

Disclaimer: CFDs are complex instruments and come with a high risk of losing your money.
I trade at FXOpen

User avatar
whiteking
rank: 150+ posts
rank: 150+ posts
Posts: 350
Joined: Fri Aug 11, 2017 2:25 am
Reputation: 32
Gender: None specified

Re: Daily analysis from FXOpen

Postby whiteking » Fri Feb 17, 2023 6:12 am

AUD/USD and NZD/USD At Risk of More Losses
Image

AUD/USD is moving lower below the 0.6880 support zone. NZD/USD is also declining and might accelerate lower below the 0.6220 support.

Important Takeaways for AUD/USD and NZD/USD
  • The Aussie Dollar started a fresh decline from the 0.7000 resistance against the US Dollar.
  • There is a key bearish trend line forming with resistance near 0.6880 on the hourly chart of AUD/USD.
  • NZD/USD also started a fresh decline below the 0.6285 support zone.
  • There is a major bearish trend line forming with resistance near 0.6260 on the hourly chart of NZD/USD.
AUD/USD Technical Analysis

The Aussie Dollar struggled to clear the key 0.7000 resistance zone against the US Dollar. The AUD/USD pair even spiked above the 0.7000 level before the bears appeared.

The pair traded as high as 0.7028 on FXOpen and started a fresh decline. There was a clear move below the 0.6920 and 0.6880 support levels. Recently, the pair declined below the 50% Fib retracement level of the recovery wave from the 0.6840 swing low to 0.6906 high.

Image
AUD/USD Hourly Chart
The pair is now trading below 0.6860 and the 50 hourly simple moving average. There is also a key bearish trend line forming with resistance near 0.6880 on the hourly chart of AUD/USD.

It is trading just below the 76.4% Fib retracement level of the recovery wave from the 0.6840 swing low to 0.6906 high. On the downside, an initial support is near the 0.6840 level. The next support could be the 0.6800 level.

If there is a downside break below the 0.6800 support, the pair could extend its decline towards the 0.670 level. On the upside, the AUD/USD pair is facing resistance near the 0.6880 level. The next major resistance is near the 0.6920 level.

A close above the 0.6920 level could start another steady increase in the near term. The next major resistance could be 0.7000.


Disclaimer: CFDs are complex instruments and come with a high risk of losing your money.
I trade at FXOpen

User avatar
whiteking
rank: 150+ posts
rank: 150+ posts
Posts: 350
Joined: Fri Aug 11, 2017 2:25 am
Reputation: 32
Gender: None specified

Re: Daily analysis from FXOpen

Postby whiteking » Mon Feb 20, 2023 5:56 am

GBP/USD Eyes Recovery While GBP/JPY Could Rise Further
Image

GBP/USD is attempting a recovery wave above the 1.2000 resistance. GBP/JPY could rise further unless there is a downside break below the 160.50 support.

Important Takeaways for GBP/USD and GBP/JPY
  • The British Pound is slowly moving higher above 1.2000 against the US Dollar.
  • There was a break above a key bearish trend line with resistance near 1.1970 on the hourly chart of GBP/USD.
  • GBP/JPY started a fresh increase above the 160.00 resistance zone.
  • There was a break above a key bearish trend line with resistance near 161.10 on the hourly chart.

GBP/USD Technical Analysis

This past week, the British Pound extended its decline below the 1.2000 support against the US Dollar. The GBP/USD pair even traded below the 1.1950 level and traded towards 1.1920.

The pair traded as low as 1.1912 on FXOpen and recently started a minor upside correction. There was a clear move above the 1.1950 resistance and the 50 hourly simple moving average. The pair even cleared the 23.6% Fib retracement level of the downward move from the 1.2268 swing high to 1.1915 low.

Image
GBP/USD Hourly Chart

It is now trading near the 1.2020 zone. An immediate resistance on the upside is near the 1.2050 level. It is near the 50% Fib retracement level of the downward move from the 1.2268 swing high to 1.1915 low.

The next major resistance is near the 1.2100 level, above which the pair could start a steady increase towards 1.2150. An upside break above 1.2150 might start a fresh increase towards 1.2200. Any more gains might call for a move towards 1.2250 or even 1.2320.

An immediate support is near the 1.2000 and the 50 hourly simple moving average. The next major support is near the 1.1950 level. If there is a break below the 1.1950 support, the pair could test the 1.1910 support. Any more losses might send GBP/USD towards 1.1840.

Disclaimer: CFDs are complex instruments and come with a high risk of losing your money.
I trade at FXOpen

User avatar
whiteking
rank: 150+ posts
rank: 150+ posts
Posts: 350
Joined: Fri Aug 11, 2017 2:25 am
Reputation: 32
Gender: None specified

Re: Daily analysis from FXOpen

Postby whiteking » Tue Feb 21, 2023 3:24 pm

[size1=05]BTCUSD and XRPUSD Technical Analysis – 21st FEB 2023[/SIZE]
Image

BTCUSD: Three WHITE Soldiers Pattern Above $22079

Bitcoin was unable to sustain its bearish momentum last week and after touching a low of $22079 the price started to correct upwards against the US dollar, touching a high of $25093 today in the Asian trading session.

We have seen a bullish opening of the markets this week.

We can clearly see the three white soldiers pattern above the $22079 handle which is a bullish reversal pattern because it signifies the end of a downtrend and a shift towards an uptrend.

Bitcoin touched an intraday low of 24681 and an intraday high of 25093 in the Asian trading session today.

We can see that the MACD indicator is back over zero in the weekly time frame indicating bullish trends.

We can see a bullish price crossover with moving average MA50 in the weekly time frame indicating bullish trends.

Both the STOCH and STOCHRSI are indicating overbought levels which means that in the immediate short term, a decline in the prices is expected.

The resistance of the channel is broken in the daily time frame indicating a bullish scenario.

The relative strength index is at 62.08 indicating a STRONG demand for bitcoin, and the continuation of the buying pressure in the markets.

Bitcoin is now moving above its 100 hourly simple moving average and above its 100 hourly exponential moving averages.

Most of the major technical indicators are giving a buy signal, which means that in the immediate short term, we are expecting targets of 25000 and 27500.

The average true range is indicating less market volatility with a strong bullish momentum.
  • Bitcoin: Bullish reversal seen above $22079.
  • The Williams percent range is giving an overbought signal.
  • The price is now trading just below its pivot level of $25005.
  • The short-term range is strongly BULLISH.
Bitcoin: Bullish Reversal Seen Above $22079

Image

The price of bitcoin is marching ahead of the $25000 levels amid improving consumer sentiments and a shift towards a high demand market.

The momentum indicator is back over zero in the 15-minute time frame indicating a bullish outlook.

The MACD crosses up its moving average in the 15-minute time frame.

We can see that the prices have entered into a supper bullish zone and now we are heading towards the $26000 and $27500 levels.

The immediate short-term outlook for bitcoin is strongly bullish, the medium-term outlook has turned bullish, and the long-term outlook remains neutral under present market conditions.

Bitcoin’s support zone is located at $23074 at which the price crosses 18-day moving average stalls, and $23315 which is a pivot point 2nd support point.

The price of BTCUSD is now facing its classic resistance level of 25077 and Fibonacci resistance level of 25120 after which the path towards 26000 will get cleared.

In the last 24hrs, BTCUSD has increased by 2.14% by 524.45$ and has a 24hr trading volume of USD 27.875 billion. We can see a decrease of 2.34% in the trading volume compared to yesterday, which appears to be normal.

The Week Ahead

Bitcoin needs to continue its bullish moves this week, which will further validate the end of the crypto winter and the start of a bullish run for Bitcoin which was long overdue.

There is an ascending channel forming with the current support at $23165 at which the price crosses the 18-day moving average.

The daily RSI is printing at 66.97 which indicates a VERY STRONG demand for bitcoin and the continuation of the bullish phase present in the markets in the short-term range.

We can see the formation of a bullish trend line from $22079 towards the $25265 level.

The price of BTCUSD is now facing its resistance zone located at $25890 which is a pivot point 2nd resistance level and $26017 which is a 3-10 day MACD oscillator stalls.

The weekly outlook is projected at $27000 with a consolidation zone of $26000.

Technical Indicators:

The average directional index (14): is at 32.84 indicating a BUY.

The ultimate oscillator: is at 53.92 indicating a BUY.

The rate of price change: is at 0.979 indicating a BUY.

Bull/bear power (13): is at 204.85 indicating a BUY.

Disclaimer: CFDs are complex instruments and come with a high risk of losing your money.

Cryptocurrency CFDs are not available to retail clients in the UK
I trade at FXOpen

User avatar
whiteking
rank: 150+ posts
rank: 150+ posts
Posts: 350
Joined: Fri Aug 11, 2017 2:25 am
Reputation: 32
Gender: None specified

Re: Daily analysis from FXOpen

Postby whiteking » Wed Feb 22, 2023 6:21 am

EUR/USD Turns Red While EUR/JPY Could Rally Further
Image

EUR/USD is struggling below the 1.0700 resistance zone. EUR/JPY is rising and might rally further if it clears the 144.20 resistance zone.

Important Takeaways for EUR/USD and EUR/JPY
  • The Euro started a fresh decline below the 1.0700 support zone.
  • There is a key bearish trend line forming with resistance near 1.0670 on the hourly chart.
  • EUR/JPY started a steady increase after it found support near the 141.50.
  • There is a major rising channel forming with support near 143.50 on the hourly chart.

EUR/USD Technical Analysis

The Euro struggled to clear the 1.0800 zone and started a fresh decline against the US Dollar. The EUR/USD pair declined below the 1.0740 support to enter a bearish zone.

There was a clear move below the 1.0700 level and the 50 hourly simple moving average. The pair even declined below the 1.0650 level before correcting a few points. The recent low was formed near 1.0637 on FXOpen and the pair is now correcting higher.

Image
EUR/USD Hourly Chart

On the upside, an immediate resistance is near the 1.0670 level. There is also a key bearish trend line forming with resistance near 1.0670 on the hourly chart.

The trend line is near the 50% Fib retracement level of the recent decline from the 1.0698 swing high to 1.0637 low. The 50 hourly simple moving average is also near the 1.0670 resistance zone. The next major resistance is near the 1.0685 level.

The 76.4% Fib retracement level of the recent decline from the 1.0698 swing high to 1.0637 low is also near 1.0685. The main resistance is near 1.0700. A clear move above the 1.0700 resistance might send the price towards 1.0750. If the bulls remain in action, the pair could visit the 1.0800 resistance zone in the near term.

On the downside, the pair might find support near the 1.0635 level. The next major support sits near the 1.0610 level, below which the pair could even test the 1.0565 support zone.

If there is a downside break below the 1.0565 support, the pair might accelerate lower in the coming sessions. In the stated case, it could even test 1.0520.


Disclaimer: CFDs are complex instruments and come with a high risk of losing your money.
I trade at FXOpen

Please add www.kreslik.com to your ad blocker white list.
Thank you for your support.


Return to “forex”