Daily analysis from FXOpen

forex live trades, setups, charts

Moderator: moderators

User avatar
whiteking
rank: 150+ posts
rank: 150+ posts
Posts: 350
Joined: Fri Aug 11, 2017 2:25 am
Reputation: 32
Gender: None specified

Re: Daily analysis from FXOpen

Postby whiteking » Wed Sep 07, 2022 5:08 am

EUR/USD Tumbles While EUR/JPY Gains Bullish Momentum

Image

EUR/USD remained in a bearish zone below 1.0000. EUR/JPY is rising and there was a clear move above the 142.00 resistance zone.

Important Takeaways for EUR/USD and EUR/JPY
  • The Euro started a major decline below the 1.0000 and 0.9980 support levels.
  • There is a key bearish trend line forming with resistance near 0.9940 on the hourly chart.
  • EUR/JPY started a fresh increase and jumped above the 142.00 resistance.
  • There is a major bullish trend line forming with support near 141.60 on the hourly chart.
EUR/USD Technical Analysis

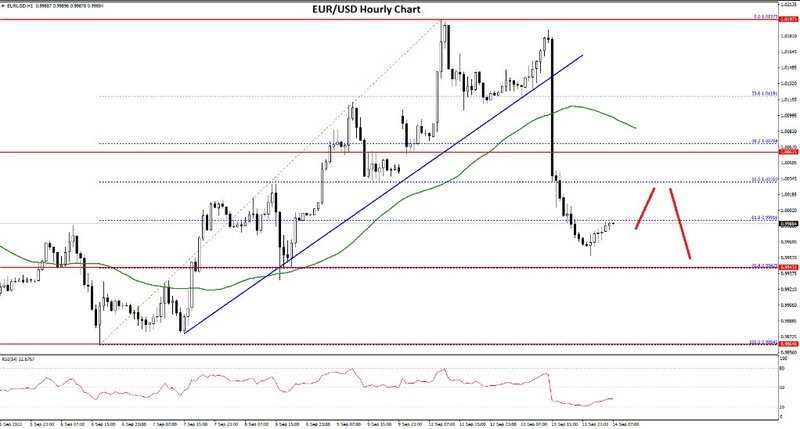
The Euro failed to start a steady recovery wave above the 1.0000 resistance against the US Dollar. The EUR/USD pair remained in a bearish zone and traded below the 0.9950 support.

There was a clear move below the 0.9940 level and the 50 hourly simple moving average. The pair even settled below the 0.9940 level. A low was formed near 0.9864 on FXOpen and the pair is now consolidating losses.

Image

EUR/USD Hourly Chart

The pair recovered above 0.9900 and the 38.2% Fib retracement level of the downward move from the 0.9986 swing high to 0.9864 low.

However, the bears were active near the 0.9925 level and the 50 hourly simple moving average. They protected gains above the 50% Fib retracement level of the downward move from the 0.9986 swing high to 0.9864 low.

There is also a key bearish trend line forming with resistance near 0.9940 on the hourly chart. On the upside, the pair is facing resistance near the 0.9925 level and the 50 hourly simple moving average.

The next major resistance is near the 0.9940 level. A clear move above the 0.9940 resistance might send the price towards 0.9980. If the bulls remain in action, the pair could revisit the 1.0050 resistance zone in the near term.

On the downside, the pair might find support near the 0.9865 level. The next major support sits near the 0.9820 level. If there is a downside break below the 0.9820 support, the pair might accelerate lower in the coming sessions.

Disclaimer: CFDs are complex instruments and come with a high risk of losing your money.
I trade at FXOpen

Please add www.kreslik.com to your ad blocker white list.
Thank you for your support.

User avatar
whiteking
rank: 150+ posts
rank: 150+ posts
Posts: 350
Joined: Fri Aug 11, 2017 2:25 am
Reputation: 32
Gender: None specified

Re: Daily analysis from FXOpen

Postby whiteking » Thu Sep 08, 2022 2:30 pm

ETHUSD Technical Analysis – 08th SEP, 2022
Image

ETHUSD: Hammer Pattern Above $1490

Ethereum was unable to sustain its bearish momentum and after touching a low of 1492 on 07th Sep started to correct upwards against the US dollar, crossing the $1600 handle in the European trading session today.

We can see a continued buying pressure since yesterday and the formation of a bullish trendline from $1490 towards $1685 level.

We can clearly see a hammer pattern above the $1490 handle which is a bullish pattern and signifies the end of a bearish phase and the start of a bullish phase in the markets.

ETH is now trading just above its pivot level of 1613 and moving into a strong bullish channel. The price of ETHUSD is now testing its classic resistance level of 1630 and Fibonacci resistance level of 1647 after which the path towards 1700 will get cleared.

The relative strength index is at 58 indicating a STRONGER demand for Ether and the continuation of the uptrend in the markets.

We can see the aroon indicator giving a bullish trend in the weekly time frame.

We have also detected a moving average crossover pattern between the MA50 & MA100 in the 30-minute time frame.

The STOCHRSI is indicating an OVERSOLD market, which means that the prices are expected to correct upwards in the short-term range.

Most of the technical indicators are giving a STRONG BUY market signal.

Most of the moving averages are giving a BUY signal and we are now looking at the levels of $1700 to $1800 in the short-term range.

ETH is now trading Above both the 100 & 200 hourly simple and exponential moving averages.
  • Ether: bullish reversal seen above the $1490 mark
  • The short-term range appears to be strongly BULLISH
  • ETH continues to remain above the $1600 levels
  • The average true range is indicating LESS market volatility
Ether: Bullish Reversal Seen Above $1490

Image

ETHUSD is moving into a strong bullish channel with the prices trading above the $1600 handle in the European trading session today.

ETH touched an intraday high of 1656 in the Asian trading session and an intraday low of 1597 in the European trading session today.

A three white soldiers pattern is visible in the 30-minutes time frame indicating the underlying bullish nature of the markets.

We can see the formation of a bullish harami cross pattern in the 15-minute time frame which indicates that now we are heading towards the $1800 mark.

The daily RSI is printing at 50 indicating a neutral demand in the long-term range.

Ethereum continues to move into a rising trend channel which is expected to continue in the short-term range.

The key support levels to watch are $1515 and $1581, and the prices of ETHUSD need to remain above these levels for the continuation of the bullish reversal in the markets.

ETH has increased by 6.68% with a price change of 101$ in the past 24hrs and has a trading volume of 18.368 billion USD.

We can see a decrease of 12.89% in the total trading volume in the last 24 hrs which appears to be normal.

The Week Ahead

On the upside the next visible targets are 1655 which is a 38.2% retracement from 4-week low, and 1726 which is a 50% retracement from 4-week high/low.

The price of Ethereum is now testing its immediate resistance zone located at $1700 and we are likely to witness a rally in the price once it touches these levels.

The immediate short-term outlook for Ether has turned strongly BULLISH, the medium-term outlook has turned NEUTRAL, and the long-term outlook for Ether is NEUTRAL in present market conditions.

The prices of ETHUSD will need to remain above the important support level of $1500 this week.

The weekly outlook is projected at $1800 with a consolidation zone of $1700.

Technical Indicators:

The relative strength index (14): is at 58.32 indicating a BUY

The moving averages convergence divergence (12,26): is at 10.23 indicating a BUY

The rate of price change: is at 3.32 indicating a BUY

The ultimate Ooscillator: is at 58.98 indicating a BUY

Disclaimer: CFDs are complex instruments and come with a high risk of losing your money.
I trade at FXOpen

User avatar
whiteking
rank: 150+ posts
rank: 150+ posts
Posts: 350
Joined: Fri Aug 11, 2017 2:25 am
Reputation: 32
Gender: None specified

Re: Daily analysis from FXOpen

Postby whiteking » Fri Sep 09, 2022 5:57 am

AUD/USD and NZD/USD Start Recovery, Key Hurdles Intact

Image

AUD/USD is gaining pace above the 0.6800 resistance. NZD/USD is rising, but it might face resistance near the 0.6130 and 0.6140 levels.

Important Takeaways for AUD/USD and NZD/USD
  • The Aussie Dollar started a fresh recovery wave above the 0.6750 resistance zone against the US Dollar.
  • There was a break above a key bearish trend line with resistance near 0.6788 on the hourly chart of AUD/USD.
  • NZD/USD started an upside correction from the 0.5965 support zone.
  • There is a connecting bearish trend line forming with resistance near 0.6105 on the hourly chart of NZD/USD.
AUD/USD Technical Analysis

The Aussie Dollar formed a base above the 0.6695 and 0.6700 levels against the US Dollar. The AUD/USD pair started a steady recovery wave after it cleared the 0.6750 resistance zone.

There was a clear move above the 0.6780 resistance and the 50 hourly simple moving average. The bulls pushed the pair above the 50% Fib retracement level of the downward move from the 0.6832 swing high to 0.6699 swing low (formed on FXOpen).

Image

AUD/USD Hourly Chart

Besides, there was a break above a key bearish trend line with resistance near 0.6788 on the hourly chart of AUD/USD. The pair is now trading above the 76.4% Fib retracement level of the downward move from the 0.6832 swing high to 0.6699 swing low.

It is also well above the 0.6800 level and the 50 hourly simple moving average. On the upside, the AUD/USD pair is facing resistance near the 0.6830 level.

The next major resistance is near the 0.6865 level. A close above the 0.6865 level could start a steady increase in the near term. The next major resistance could be 0.6950.

On the downside, an initial support is near the 0.6800 level. The next support could be the 0.6780 level. If there is a downside break below the 0.6780 support, the pair could extend its decline towards the 0.6750 level.

Disclaimer: CFDs are complex instruments and come with a high risk of losing your money.
I trade at FXOpen

User avatar
whiteking
rank: 150+ posts
rank: 150+ posts
Posts: 350
Joined: Fri Aug 11, 2017 2:25 am
Reputation: 32
Gender: None specified

Re: Daily analysis from FXOpen

Postby whiteking » Mon Sep 12, 2022 6:11 am

GBP/USD Recovers, EUR/GBP Eyes More Upsides

Image

GBP/USD started a fresh increase above the 1.1550 zone. EUR/GBP is rising and might climb further higher above the 0.8700 resistance.

Important Takeaways for GBP/USD and EUR/GBP
  • The British Pound started a fresh recovery wave above the 1.1550 resistance zone against the US Dollar.
  • There is a key bullish trend line forming with support near 1.1585 on the hourly chart of GBP/USD.
  • EUR/GBP climbed higher above the 0.8620 and 0.8650 resistance levels.
  • There is a major bullish trend line forming with support near 0.8665 on the hourly chart.
GBP/USD Technical Analysis

The British Pound found support near the 1.1420 zone against the US Dollar. The GBP/USD pair started a recovery wave and was able to clear the 1.1500 resistance zone.

There was a decent increase above the 1.1550 level and the 50 hourly simple moving average. The pair even climbed above the 1.1600 level. A high was formed near 1.1641 on FXOpen and the pair is now correcting gains.
Image

GBP/USD Hourly Chart

There was a move below the 1.1620 level. The pair declined below the 23.6% Fib retracement level of the upward move from the 1.1550 swing low to 1.1641 high.

On the downside, an initial support is near the 1.1600 level. It is near the 50% Fib retracement level of the upward move from the 1.1550 swing low to 1.1641 high. There is also a key bullish trend line forming with support near 1.1585 on the hourly chart of GBP/USD.

The next major support is near the 1.1550 level. Any more losses could lead the pair towards the 1.1500 support zone or even 1.1420.

On the upside, an initial resistance is near the 1.1640 level. The next main resistance is near the 1.1650 zone. A clear upside break above the 1.1640 and 1.1650 resistance levels could open the doors for a steady increase in the near term. The next major resistance sits near the 1.1715 level.


Disclaimer: CFDs are complex instruments and come with a high risk of losing your money.
I trade at FXOpen

User avatar
whiteking
rank: 150+ posts
rank: 150+ posts
Posts: 350
Joined: Fri Aug 11, 2017 2:25 am
Reputation: 32
Gender: None specified

Re: Daily analysis from FXOpen

Postby whiteking » Tue Sep 13, 2022 1:56 pm

BTCUSD and XRPUSD Technical Analysis – 13th SEP 2022
Image

BTCUSD: Inverted Hammer Pattern Above $19025

Bitcoin was unable to sustain its bearish momentum and after touching a low of 18567 on 07th Sep, it started to correct upwards crossing the $22000 handle today in the European trading session.

The price of Bitcoin continues to correct upwards due to the increased buying pressure and more upsides are expected towards the $25000 levels.

We can see a bullish price crossover with the adaptive moving average AMA50 in the 15-minute time frame.

We have also seen a bullish opening gap underpinning the markets this week.

We can clearly see an inverted hammer pattern above the $19025 handle which is a bullish reversal pattern because it signifies the end of a downtrend and a shift towards an uptrend.

Bitcoin touched an intraday low of 22067 in the Asian trading session and an intraday high of 22553 in the European trading session today.

Both the STOCH and Williams percent range are indicating overbought levels which means that in the immediate short term a decline in the prices is expected.

The relative strength index is at 71 indicating a very strong demand for bitcoin at the current market levels and the continuation of the buying pressure in the markets.

Bitcoin is now moving above its 100 hourly simple moving average and below its 200 hourly exponential moving averages.

All of the major technical Indicators are giving a STRONG BUY signal, which means that in the immediate short term we are expecting targets of 24000 and 25000.

The average true range is indicating LESS market volatility with a strong bullish momentum.
  • Bitcoin: bullish reversal seen above $19025.
  • STOCHRSI is indicating an oversold level.
  • The price is now trading just above its pivot level of $22332.
  • All of the moving averages are giving a STRONG BUY market signal.
Bitcoin: Bullish reversal seen above $19025
Image


The price of bitcoin is forming an ascending channel, with the current price action indicating a move towards the consolidation phase above the $22000 handle.

We can see the formation of a bullish harami pattern in the 2-hourly time-frame indicating the underlying bullish nature of the markets.

We have also detected the formation of a bullish engulfing line in the 1-hourly time frame indicating the bullish scenario.

The immediate short-term outlook for bitcoin is bullish, the medium-term outlook has turned neutral, and the long-term outlook remains neutral under present market conditions.

Bitcoin’s support zone is located at $21000 and the price continues to remain above these levels for the continuation of the bullish reversal in the markets.

The price of BTCUSD is now facing its classic resistance level of 22502 and Fibonacci resistance level of 22731 after which the path towards 23000 will get cleared.

In the last 24hrs BTCUSD has increased by 0.95% by 211$ and has a 24hr trading volume of USD 43.846 billion. We can see a decrease of 2.98% in the trading volume as compared to yesterday, which appears to be normal.

The Week Ahead

The price of bitcoin is moving in a consolidation zone above the $22000 levels. At present the price is moving into a narrow range between the 22000 and 22500 levels.

We can see that the price of bitcoin is super bullish and we are heading towards the $30000 handle in the medium term range.

The daily RSI is printing at 61 which indicates a very strong demand from the long-term investors.

The price of BTCUSD will need to remain above the important support levels of $21000 this week.

The weekly outlook is projected at $25000 with a consolidation zone of $24500.

Technical Indicators:

The moving averages convergence divergence (12, 26): is at 564.30 indicating a BUY.

The ultimate oscillator: is at 57.64 indicating a BUY.

The rate of price change: is at 5.34 indicating a BUY.

The commodity channel index (14): is at 105.75 indicating a BUY.

Disclaimer: CFDs are complex instruments and come with a high risk of losing your money.
I trade at FXOpen

Please add www.kreslik.com to your ad blocker white list.
Thank you for your support.

User avatar
whiteking
rank: 150+ posts
rank: 150+ posts
Posts: 350
Joined: Fri Aug 11, 2017 2:25 am
Reputation: 32
Gender: None specified

Re: Daily analysis from FXOpen

Postby whiteking » Wed Sep 14, 2022 6:13 am

EUR/USD Trims Gains, USD/JPY Ames New High
Image

EUR/USD started another decline from the 1.0200 resistance. USD/JPY is rising and might soon clear the key 145.00 resistance zone.

Important Takeaways for EUR/USD and USD/JPY
  • The Euro started a fresh decline and even traded below the 1.0020 support.
  • There was a break below a major bullish trend line with support near 1.0140 on the hourly chart of EUR/USD.
  • USD/JPY started a fresh increase after it remained well bid above the 141.50 support.
  • There is a key bullish trend line forming with support near 142.30 on the hourly chart.
EUR/USD Technical Analysis

This past week, the Euro was able to recover above the 1.0100 level against the US Dollar. The EUR/USD pair even broke the 1.0150 level, but the bears were active near the 1.0200 zone.

A high was formed near 1.0197 on FXOpen and the pair started a fresh decline. There was a clear move below the 1.0150 and 1.0120 support levels. The pair declined below the 50% Fib retracement level of the upward move from the 0.9864 swing low to 1.0197 high.

Image

EUR/USD Hourly Chart

Besides, there was a break below a major bullish trend line with support near 1.0140 on the hourly chart of EUR/USD. The pair is now trading below the 1.0050 level and the 50 hourly simple moving average.

An immediate resistance on the upside is near the 1.0000 level. The next major resistance is near the 1.0030 level. An upside break above 1.0030 could set the pace for a steady increase. In the stated case, the pair might revisit 1.0080.

Any more gains might send the pair towards 1.0120. If not, the pair might drop and test the 0.9950 support. The next major support is near 0.9920, below which the pair could drop to 0.9860 in the near term.

Disclaimer: CFDs are complex instruments and come with a high risk of losing your money.
I trade at FXOpen

User avatar
whiteking
rank: 150+ posts
rank: 150+ posts
Posts: 350
Joined: Fri Aug 11, 2017 2:25 am
Reputation: 32
Gender: None specified

Re: Daily analysis from FXOpen

Postby whiteking » Thu Sep 15, 2022 1:29 pm

ETHUSD and LTCUSD Technical Analysis – 15th SEP, 2022
Image

ETHUSD: Hammer Pattern Above $1551

Ethereum was unable to sustain its bullish momentum and after touching a high of 1788 on 11th Sep the price started to decline against the US dollar. This decline was mainly attributed to the strength of the US dollar in the global markets and the subsequent increase in the market liquidity.

We can see a continued buying pressure since yesterday and the formation of a bullish price crossover pattern with moving averages MA20, MA50 and MA100 in the 15-minute time frame.

We can clearly see a hammer pattern above the $1551 handle which is a bullish pattern and signifies the end of a bearish phase and the start of a bullish phase in the markets.

ETH is now trading just above its pivot level of 1599 and moving in a strong bullish channel. The price of ETHUSD is now testing its classic resistance level of 1625 and Fibonacci resistance level of 1651 after which the path towards 1700 will get cleared.

The relative strength index is at 56 indicating a STRONGER demand for Ether and the continuation of the uptrend in the markets.

We can see that the super trend indicator is giving a bullish reversal signal in the 15-minute time frame.

We have also detected a bullish harami cross pattern in the 1 -hour time frame.

The STOCHRSI is indicating an OVERBOUGHT market, which means that the prices are expected to decline in the short-term range.

Most of the technical indicators are giving a STRONG BUY market signal.

Most of the moving averages are giving a BUY signal and we are now looking at the levels of $1750 to $1900 in the short-term range.

ETH is now trading below both the 100 & 200 hourly simple and exponential moving averages.
  • Ether: bullish reversal seen above the $1551 mark
  • Short-term range appears to be strongly BULLISH
  • ETH continues to remain above the $1600 level
  • The average true range is indicating HIGH market volatility[/b]
Ether: Bullish Reversal Seen Above $1551
Image

ETHUSD is now moving into a strongly bullish channel with the prices trading above the $1600 handle in the European trading session today.

ETH touched an intraday low of 1571 and an intraday high of 1651 in the European trading session today.

We have seen a bullish opening of the markets today indicating the underlying bullish nature of the markets.

We can see that MACD has crossed UP its moving average in the 4-hour time frame indicating the bullish tone, and now we are looking at the levels of 1800 to 2000 in the medium-term range.

The daily RSI is printing at 48 indicating a neutral demand in the long-term range.

The key support levels to watch are $1566 and $1501 and the prices of ETHUSD need to remain above these levels for the continuation of the bullish reversal in the markets.

ETH has increased by 1.40% with a price change of 22.33$ in the past 24hrs and has a trading volume of 24.474 billion USD.

We can see an increase of 5.50% in the total trading volume in the last 24 hrs which appears to be normal.

Technical Indicators:

The average directional change (14): is at 24.06 indicating a BUY

The moving averages convergence divergence (12,26): is at 0.48 indicating a BUY

The rate of price change: is at 2.61 indicating a BUY

The ultimate oscillator: is at 62.47 indicating a BUY

Disclaimer: CFDs are complex instruments and come with a high risk of losing your money.
I trade at FXOpen

User avatar
whiteking
rank: 150+ posts
rank: 150+ posts
Posts: 350
Joined: Fri Aug 11, 2017 2:25 am
Reputation: 32
Gender: None specified

Re: Daily analysis from FXOpen

Postby whiteking » Fri Sep 16, 2022 6:06 am

Gold Price and Crude Oil Price At Risk of More Losses
Image

Gold price started a fresh decline below the $1,685 support zone. Crude oil price is also struggling and remains at a risk of more losses.

Important Takeaways for Gold and Oil
  • Gold price started a fresh decline after it failed to stay above $1,700 against the US Dollar.
  • There is a key bearish trend line forming with resistance near $1,675 on the hourly chart of gold.
  • Crude oil price also started a steady decline from the $90.00 zone.
  • There was a break below a major bullish trend line with support near $87.50 on the hourly chart of XTI/USD.

Gold Price Technical Analysis

Gold price attempted to gain pace above the $1,735 level against the US Dollar. However, the price failed to stay above $1,720 and started a fresh decline.

There was a clear move below the $1,700 support zone and the 50 hourly simple moving average. The price declined below the $1,675 level to move into a bearish zone. The decline gained pace below the $1,670 level.

Image

Gold Price Hourly Chart

The price traded as low as $1,660 and is currently consolidating losses. On the upside, the price is facing resistance near the $1,670 level.

The first major resistance is near the $1,675 level. There is also a key bearish trend line forming with resistance near $1,675 on the hourly chart of gold. The trend line is near the 23.6% Fib retracement level of the recent decline from the $1,735 swing high to $1,660 low.

The main resistance is now forming near the $1,688 level and the 50 hourly simple moving average, above which it could even test the 50% Fib retracement level of the recent decline from the $1,735 swing high to $1,660 low.

A clear upside break above the $1,700 resistance could send the price towards $1,735. An immediate support on the downside is near the $1,660 level. The next major support is near the $1,650 level, below which there is a risk of a larger decline. In the stated case, the price could decline sharply towards the $1,620 support zone.

Disclaimer: CFDs are complex instruments and come with a high risk of losing your money.
I trade at FXOpen

User avatar
whiteking
rank: 150+ posts
rank: 150+ posts
Posts: 350
Joined: Fri Aug 11, 2017 2:25 am
Reputation: 32
Gender: None specified

Re: Daily analysis from FXOpen

Postby whiteking » Mon Sep 19, 2022 5:08 am

GBP/USD Turns Red While USD/CAD Aims Higher
Image

GBP/USD is trading in a bearish zone below the 1.1480 and 1.1440 support levels. USD/CAD is surging and could continue to rise above the 1.3300 resistance zone.

Important Takeaways for GBP/USD and USD/CAD
  • The British Pound started a major decline below the 1.1550 support zone.
  • There is a key bearish trend line forming with resistance near 1.1415 on the hourly chart of GBP/USD.
  • USD/CAD started a fresh increase above the 1.3200 resistance zone.
  • There is a connecting bullish trend line forming with support near 1.3220 on the hourly chart.
GBP/USD Technical Analysis

After a strong rejection near 1.1740, the British Pound started a fresh decline against the US Dollar. GBP/USD declined heavily below the 1.1550 support zone.

There was a move below the 1.1500 support zone and the 50 hourly simple moving average. The pair even traded below the 1.1480 support zone and formed a low near 1.1350 on FXOpen. It is now consolidating losses above the 1.1350 level.

Image

GBP/USD Hourly Chart

An immediate resistance is near the 1.1415 level. There is also a key bearish trend line forming with resistance near 1.1415 on the hourly chart of GBP/USD. The next resistance is near the 1.1440 level or the 38.2% Fib retracement level of the downward move from the 1.1589 swing high to 1.1350 low.

The main resistance is near the 1.1480 level. It is near the 50% Fib retracement level of the downward move from the 1.1589 swing high to 1.1350 low.

If there is an upside break above the 1.1480 zone, the pair could rise towards 1.1550. The next key resistance could be 1.1580, above which the pair could gain strength.

On the downside, an initial support is near the 1.1380 area. The first major support is near the 1.1350 level. If there is a break below 1.1350, the pair could extend its decline. The next key support is near the 1.1300 level. Any more losses might call for a test of the 1.1240 support.

Disclaimer: CFDs are complex instruments and come with a high risk of losing your money.
I trade at FXOpen

User avatar
whiteking
rank: 150+ posts
rank: 150+ posts
Posts: 350
Joined: Fri Aug 11, 2017 2:25 am
Reputation: 32
Gender: None specified

Re: Daily analysis from FXOpen

Postby whiteking » Tue Sep 20, 2022 1:47 pm

BTCUSD and XRPUSD Technical Analysis – 20th SEP 2022
Image

BTCUSD: Bullish Engulfing Pattern Above $18293

Bitcoin was unable to sustain its bearish momentum and after touching a low of 18322 on 19th Sep, it has entered into a consolidation channel above the $19000 handle today in the European trading session.

The price of bitcoin continues to move in a tight range between 19200 and 19700 levels today suggesting that we have hit the bottom of the downtrend.

We can see the formation of an ascending channel pattern on the hourly chart of the BTCUSD.

The price of bitcoin is nearing the horizontal support level in the daily time frame indicating the bullish tone in the markets.

We can clearly see a bullish engulfing pattern above the $18293 handle which is a bullish reversal pattern because it signifies the end of a downtrend and a shift towards an uptrend.

Bitcoin touched an intraday high of 19679 in the Asian trading session and an intraday low of 19195 in the European trading session today.

Both the STOCH and Williams percent range are indicating overbought levels which means that in the immediate short term a decline in the prices is expected.

The relative strength index is at 53 indicating a NEUTRAL demand for bitcoin at the current market levels and the continuation of the buying pressure in the markets.

Bitcoin is now moving below its 100 hourly simple moving average and below its 200 hourly exponential moving averages.

Some of the major technical indicators are giving a BUY signal, which means that in the immediate short term, we are expecting targets of 20000 and 21500.

The average true range is indicating LESS market volatility with a mild bullish momentum.
  • Bitcoin: bullish reversal seen above $18293
  • The commodity channel index is indicating a neutral level
  • The price is now trading just above its pivot level of $19399
  • Some of the moving averages are giving a BUY market signal
Bitcoin: Bullish Reversal Seen Above $18293
Image

The price of bitcoin has crashed below the important support level of $19000 due to the strength of the US dollar and the increase in the global market liquidity pattern.

The adaptive moving average AMA50 and moving average MA20 is giving a bullish trend reversal signal in the 15-minutes time frame.

We can see that the momentum indicator is giving a bullish trend signal in the weekly time frame.

We have also detected a bullish opening of the markets indicating the underlying bullish sentiment.

The immediate short-term outlook for bitcoin is bullish, the medium-term outlook has turned neutral, and the long-term outlook remains neutral under present market conditions.

Bitcoin’s support zone is located at $18000 and the prices continue to remain above these levels for the continuation of the bullish reversal in the markets.

The price of BTCUSD is now facing its сlassic resistance level of 19544 and Fibonacci resistance level of 19722 after which the path towards 20000 will get cleared.

In the last 24hrs BTCUSD has increased by 4.77% by 881$ and has a 24hr trading volume of USD 36.188 billion. We can see an increase of 6.47% in the trading volume compared to yesterday, which appears to be normal.

The Week Ahead

The price of bitcoin is moving in a consolidation zone above the $19000 level. At present the price of bitcoin is gaining a bullish traction against the US dollar in the medium-term range.

We can see the buildup of positive momentum in the markets with the prices moving close to the psychological support level of $20000.

The daily RSI is printing at 40 which indicates a weak demand from the long-term investors.

The price of BTCUSD will need to remain above the important support level of $18500 this week.

The weekly outlook is projected at $21000 with a consolidation zone of $20000.

Technical Indicators:

The moving averages convergence divergence (12,26): is at 5.20 indicating a BUY

The ultimate oscillator: is at 51.34 indicating a BUY

The rate of price change: is at 0.70 indicating a BUY

The average directional change (14): is at 28.61 indicating a BUY

Disclaimer: CFDs are complex instruments and come with a high risk of losing your money.
I trade at FXOpen

Please add www.kreslik.com to your ad blocker white list.
Thank you for your support.


Return to “forex”