Daily analysis from FXOpen

forex live trades, setups, charts

Moderator: moderators

User avatar
whiteking
rank: 150+ posts
rank: 150+ posts
Posts: 350
Joined: Fri Aug 11, 2017 2:25 am
Reputation: 32
Gender: None specified

Re: Daily analysis from FXOpen

Postby whiteking » Wed Jan 25, 2023 5:16 am

EUR/USD Resumes Increase While USD/CHF Could Breakdown

Image

EUR/USD gained pace above the 1.0850 resistance zone. USD/CHF is declining and remains at a risk of more losses below the 0.9220 support.

Important Takeaways for EUR/USD and USD/CHF
  • The Euro started a fresh increase above the 1.0850 resistance against the US Dollar.
  • There is a key bullish trend line forming with support near 1.0845 on the hourly chart of EUR/USD.
  • USD/CHF started a fresh decline below the 0.9260 and 0.9250 support levels.
  • There is a major bullish trend line forming with support near 0.9220 on the hourly chart.

EUR/USD Technical Analysis

In the past few days, the Euro started a steady increase from the 1.0780 zone against the US Dollar. The EUR/USD pair gained pace above the 1.0820 level to move into a bullish zone.

The pair even climbed above the 1.0850 resistance and settled above the 50 hourly simple moving average. It traded as high as 1.0927 on FXOpen and recently started a downside correction. There was a move below the 1.0880 level.

Image

EUR/USD Hourly Chart

The pair traded as low as 1.0835 and is currently rising. There was a clear move above the 50% Fib retracement level of the recent decline from the 1.0927 swing high to 1.0835 low.

An immediate resistance is near the 1.0900 level. It is near the 76.4% Fib retracement level of the recent decline from the 1.0927 swing high to 1.0835 low. The next major resistance is near the 1.0920 level.

A clear move above the 1.0920 resistance zone could set the pace for a larger increase towards 1.0965. The next major resistance is near the 1.1000 zone. On the downside, an immediate support is near the 1.0880 level.

The next major support is near the 1.0850 level. There is also a key bullish trend line forming with support near 1.0845 on the hourly chart of EUR/USD. A downside break below the 1.0850 support could start another decline.

Disclaimer: CFDs are complex instruments and come with a high risk of losing your money.
I trade at FXOpen

Please add www.kreslik.com to your ad blocker white list.
Thank you for your support.

User avatar
whiteking
rank: 150+ posts
rank: 150+ posts
Posts: 350
Joined: Fri Aug 11, 2017 2:25 am
Reputation: 32
Gender: None specified

Re: Daily analysis from FXOpen

Postby whiteking » Thu Jan 26, 2023 7:01 pm

ETHUSD and LTCUSD Technical Analysis – 26th JAN, 2023

Image

ETHUSD: Three Inside Up Pattern Above $1518

Ethereum was unable to sustain its bearish momentum and after touching a low of 1518 on 25th Jan, the price started to correct upwards against the US dollar crossing the $1600 handle today in the European trading session.

We have seen a bullish opening of the markets this week.

We can clearly see a three inside up pattern above the $1518 handle which is a bullish pattern and signifies the end of a bearish phase and the start of a bullish phase in the markets.

ETH is now trading just below its pivot level of 1607 and moving into a mildly bullish channel. The price of ETHUSD is now testing its classic resistance level of 1610 and Fibonacci resistance level of 1613 after which the path towards 1700 will get cleared.

The relative strength index is at 56.75 indicating a STRONG demand for Ether and the continuation of the bullish phase in the markets.

The price of Ethereum is ranging near the horizontal support in the 1-hour time frame indicating bullish trends.

Both the STOCH and CCI are indicating a neutral market, which means that the prices are expected to remain in a consolidation phase.

Most of the technical indicators are giving a BUY market signal.

Most of the moving averages are giving a BUY signal and we are now looking at the levels of $1650 to $1700 in the short-term range.

ETH is now trading above both the 100 & 200 hourly simple and exponential moving averages.
  • Ether: bullish reversal seen above the $1518 mark
  • The short-term range appears to be mildly bullish
  • ETH continues to remain above the $1600 level
  • The average true range is indicating LESS market volatility

Ether: Bullish Reversal Seen Above $1518

Image

ETHUSD is now moving into a mildly bullish channel with the price trading above the $1600 handle in the European trading session today.

ETH touched an intraday high of 1625 in the Asian trading session and an intraday low of 1600 in the European trading session today.

We can see the formation of a bullish price crossover pattern with adaptive moving average AMA20 in the 30-minute time frame.

The Aroon indicator is giving a bullish trend in the 4-hour time frame.

We have also detected the formation of moving average bullish crossovers: MA50 & MA100 in the daily time frame.

Ethereum’s price is rising sharply against the US dollar and nitcoin and is now eyeing to cross the $1700 level soon.

The daily RSI is printing at 65.97 indicating a STRONG demand for Ether in the medium-term range.

The key support levels to watch are $1489 which is a 38.2% Retracement from a 4-week high, and $1536 which is a 3-10-16 day MACD moving average stalls.

ETH has increased by 3.98% with a price change of 61.50$ in the past 24hrs and has a trading volume of 10.232 billion USD.

We can see an increase of 10.64% in the total trading volume in the last 24 hrs which appears to be normal.

The Week Ahead

ETH price continues to remain in a bullish zone against the US dollar and bitcoin. ETHUSD is expected to move higher towards the $11650 and $1700 levels this week.

On the upside we are now looking at the immediate targets of 1677 which is a 13-week high, and $1685 which is a pivot point 2nd level resistance.

The immediate short-term outlook for Ether has turned strongly bullish, the medium-term outlook has turned bullish, and the long-term outlook for Ether is neutral in present market conditions.

The price of ETHUSD will need to remain above the important support level of $1588 which is a pivot point.

The weekly outlook is projected at $1700 with a consolidation zone of $1650.

Technical Indicators:

The average directional index, ADX (14): is at 45.27 indicating a BUY

The rate of price change: is at 2.735 indicating a BUY

Bull/bear power (13): is at 7.52 indicating a BUY

The Williams percent range : is at -44.41 indicating a BUY

Disclaimer: CFDs are complex instruments and come with a high risk of losing your money.
I trade at FXOpen

User avatar
whiteking
rank: 150+ posts
rank: 150+ posts
Posts: 350
Joined: Fri Aug 11, 2017 2:25 am
Reputation: 32
Gender: None specified

Re: Daily analysis from FXOpen

Postby whiteking » Fri Jan 27, 2023 6:16 am

Gold Price Could Dip While Crude Oil Price Trades In Range

Image

Gold price is struggling to stay above the $1,925 support. Crude oil price is facing a strong resistance near the $82 zone.

Important Takeaways for Gold and Oil
  • Gold price started a strong increase and tested $1,950 against the US Dollar.
  • There is a key bullish trend line forming with support near $1,925 on the hourly chart of gold.
  • Crude oil price started a fresh increase from the $79.50 support zone.
  • There is a major bullish trend line forming with support near $80.40 on the hourly chart of XTI/USD.
Gold Price Technical Analysis

Gold price formed a base above the $1,900 level against the US Dollar. The price started a strong increase above the $1,915 and $1,920 resistance levels to move into a positive zone.

The bulls even pumped the price above the $1,940 and the 50 hourly simple moving average. The price even tested the $1,950 zone. A high is formed near $1,949 on FXOpen and the price is now correcting gains.

Image

Gold Price Hourly Chart

There was a move below the $1,940 level and the 50 hourly simple moving average. The price even dipped below the $1,920 level before the bulls appeared.

Recently, there was a recovery wave above the 23.6% Fib retracement level of the downward move from the $1,949 swing high to $1,918 low. However, the bears are active below the $1,935 level and the 50 hourly simple moving average.

The price failed to clear the 50% Fib retracement level of the downward move from the $1,949 swing high to $1,918 low. It is now moving lower below $1,930.

An immediate support on the downside is near the $1,925 level. There is also a key bullish trend line forming with support near $1,925 on the hourly chart of gold. The next major support is near the $1,915 level, below which there is a risk of a larger decline. In the stated case, the price could decline sharply towards the $1,900 support zone.

On the upside, the first major resistance is near the $1,930 level. The next key hurdle is near the $1,935 level, above which it could even test $1,950. A clear upside break above the $1,950 resistance could send the price towards $1,965.

Disclaimer: CFDs are complex instruments and come with a high risk of losing your money.
I trade at FXOpen

User avatar
whiteking
rank: 150+ posts
rank: 150+ posts
Posts: 350
Joined: Fri Aug 11, 2017 2:25 am
Reputation: 32
Gender: None specified

Re: Daily analysis from FXOpen

Postby whiteking » Mon Jan 30, 2023 5:25 am

GBP/USD and GBP/JPY Could Resume Increase

Image

GBP/USD is consolidating gains pace above the 1.2350 zone. GBP/JPY is also rising and might gain pace if it clears the 161.80 resistance zone.

Important Takeaways for GBP/USD and GBP/JPY
  • The British Pound is showing positive signs above 1.2350 against the US Dollar.
  • There is a key contracting triangle forming with resistance near 1.2400 on the hourly chart of GBP/USD.
  • GBP/JPY started a fresh increase above the 160.00 resistance zone.
  • There is a major bullish trend line forming with support near 160.90 on the hourly chart.

GBP/USD Technical Analysis

This past week, the British Pound found support near the 1.2280 zone against the US Dollar. The GBP/USD pair formed a base and started a steady increase above the 1.23200 level.

There was a clear move above the 1.2350 resistance and the 50 hourly simple moving average. The pair even cleared the 1.2400 resistance. A high is formed near 1.2418 on FXOpen and the pair corrected lower.

Image

GBP/USD Hourly Chart

There was a move below the 1.2380 level, but the bulls were active near the 1.2345. The pair is now rising and trading above the 50% Fib retracement level of the recent decline from the 1.2418 swing high to 1.2345 low.

An immediate resistance on the upside is near the 1.2400 level. There is also a key contracting triangle forming with resistance near 1.2400 on the hourly chart of GBP/USD.

The triangle resistance is near the 76.4% key contracting triangle forming with resistance near 1.2400 on the hourly chart of GBP/USD. The next major resistance is near the 1.2420 level, above which the pair could start a steady increase towards 1.2450.

An upside break above 1.2450 might start a fresh increase towards 1.2550. Any more gains might call for a move towards 1.2600 or even 1.2640.

An immediate support is near the 1.2380. The next major support is near the 1.2350 level. If there is a break below the 1.2350 support, the pair could test the 1.2280 support. Any more losses might send GBP/USD towards 1.2220.

Disclaimer: CFDs are complex instruments and come with a high risk of losing your money.
I trade at FXOpen

User avatar
whiteking
rank: 150+ posts
rank: 150+ posts
Posts: 350
Joined: Fri Aug 11, 2017 2:25 am
Reputation: 32
Gender: None specified

Re: Daily analysis from FXOpen

Postby whiteking » Tue Jan 31, 2023 2:30 pm

BTCUSD and XRPUSD Technical Analysis – 31st JAN 2023

Image

BTCUSD: Double Bottom Pattern Above $22396

Bitcoin continues its bullish momentum from last week and after touching a low of $22396 on 25th Jan, the prices started to correct upwards against the US dollar and are now ranging above the $22500 handle in the European trading session today.

We have seen a bullish opening of the markets this week.

We can clearly see a double bottom pattern above the $22396 handle which is a bullish reversal pattern because it signifies the end of a downtrend and a shift towards an uptrend.

Bitcoin touched an intraday low of 22543 in the Asian trading session and an intraday high of 22992 in the European trading session today.

The price of bitcoin is ranging near a new record high of 1 month.

We can see the formation of a bullish harami and bullish harami cross pattern in the daily time frame.

Both the STOCH and Williams percent range are indicating overbought levels which means that in the immediate short term, a decline in the prices is expected.

We have also detected a bullish doji star pattern in the 30-minute time frame indicating bullish trends.

The relative strength index is at 56.23 indicating a strong demand for bitcoin, and the continuation of the buying pressure in the markets.

Bitcoin is now moving below its 100 hourly simple moving average and above its 100 hourly exponential moving averages.

Most of the major technical indicators are giving a buy signal, which means that in the immediate short term, we are expecting targets of 23000 and 24500.

The average true range is indicating high market volatility with a mildly bullish momentum.
  • Bitcoin: bullish continuation seen above $22396
  • The commodity channel index is indicating a neutral level
  • The price is now trading just below its pivot level of $22884
  • The short-term range is mildly bullish
Bitcoin: Bullish Continuation Seen Above $22396
Image

The price of bitcoin witnessed a downwards correction after touching $23926 as the target of $24K was rejected by the bulls. Now the markets are ranging into a consolidation channel above the $22500 handle.

After the consolidation phase is over, we are expecting upside moves in the range of $23500 to $24000 levels.

The resistance of the channel is broken in the 15-minute time frame.

We can see the formation of a bullish trend reversal pattern with the moving average MA20 in the 15-minute time frame.

The immediate short-term outlook for bitcoin is mildly bullish, the medium-term outlook has turned bullish, and the long-term outlook remains neutral under present market conditions.

Bitcoin’s support zone is located at $20780 at which the price crosses 9-day moving average stalls, and at $21091 which is a 38.2% retracement from a 4-week high.

The price of BTCUSD is now facing its classic resistance level of 22928 and Fibonacci resistance level of 22950 after which the path towards 23000 will get cleared.

In the last 24hrs BTCUSD has decreased by 1.85% by 432.62$ and has a 24hr trading volume of USD 25.925 billion. We can see a decrease of 5.10% in the trading volume compared to yesterday, which appears to be normal.

The Week Ahead

Bitcoin has reached its highest level this month at $23956 which is a positive sign after the harsh crypto winter season seen last year.

The daily RSI is printing at 69.281 which indicates a very strong demand for bitcoin and the continuation of the bullish phase present in the markets in the short-term range.

We can see the formation of a bullish trend line from $22396 towards the $23983 level.

The price of BTCUSD is now facing its resistance zone located at $23098 which is a pivot point, and at $23527 which is a 3-10 day MACD oscillator stalls.

The weekly outlook is projected at $24000 with a consolidation zone of $23500.

Technical Indicators:

The moving averages convergence divergence (12,26): is at 1256.90 indicating a BUY

The ultimate oscillator: is at 52.29 indicating a BUY

The rate of price change : is at 8.37 indicating a BUY

Bull/bear power (13): is at 856.36 indicating a BUY

Cryptocurrency CFDs are not available to retail clients in the UK

Disclaimer: CFDs are complex instruments and come with a high risk of losing your money.
I trade at FXOpen

Please add www.kreslik.com to your ad blocker white list.
Thank you for your support.

User avatar
whiteking
rank: 150+ posts
rank: 150+ posts
Posts: 350
Joined: Fri Aug 11, 2017 2:25 am
Reputation: 32
Gender: None specified

Re: Daily analysis from FXOpen

Postby whiteking » Thu Feb 02, 2023 1:57 pm

ETHUSD and LTCUSD Technical Analysis – 02nd FEB, 2023
Image

ETHUSD: Three White Soldiers Pattern Above $1535

Ethereum was unable to sustain its bearish momentum and after touching a low of 1535 on 30th Jan, the price started to correct upwards against the US dollar crossing the $1650 handle today in the Asian trading session.

After touching a high of $1694 the prices have retracted due to profit taking by the medium-term investors.

We have seen a bullish opening of the markets this week.

We can clearly see a three white soldiers pattern above the $1535 handle which is a bullish pattern and signifies the end of a bearish phase and the start of a bullish phase in the markets.

ETH is now trading just below its pivot level of 1665 and moving into a strong bullish channel. The price of ETHUSD is now testing its classic resistance level of 1668 and Fibonacci resistance level of 1673 after which the path towards 1700 will get cleared.

We have also seen the formation of a Bullish engulfing line in the weekly time frame.

The price of Ethereum is ranging near the support of the channel in the 15-minute time frame indicating a bullish scenario.

The relative strength index is at 68.86 indicating a strong demand for Ether and the continuation of the buying pressure in the markets.

The Williams percent range is indicating an overbought market, which means that the price is expected to decline in the short-term range.

Most of the technical indicators are giving a strong buy market signal.

Most of the moving averages are giving a strong buy signal at the current market level of $1666.

ETH is now trading above both the 100 hourly simple and 100 hourly exponential moving averages.
  • Ether: bullish reversal seen above the $1535 mark
  • Short-term range appears to be strongly bullish
  • ETH continues to remain above the $1650 level
  • The average true range is indicating less market volatility
Ether: Bullish Reversal Seen Above $1535
Image

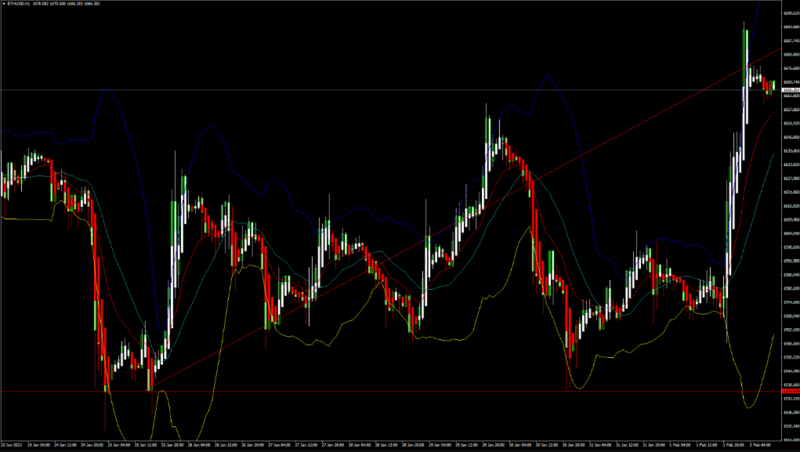
ETHUSD continues to trade higher against the US dollar and bitcoin. The price of Ethereum remains supported above the $1600 level and now we are testing the break of the $1700 handle.

We can see the formation of a B=bullish price crossover pattern with adaptive moving average AMA20 in the weekly time frame.

The momentum indicator is back over zero in the daily time frame indicating bullish trends.

We have also detected the formation of a bullish harami pattern in the 4-hour time frame.

ETHUSD touched an intraday low of 1633 and an intradayhHigh of 1694 in the Asian trading session today.

The STOCHRSI is indicating an oversold level, which indicates that the prices will continue to rise in the medium-term range.

The key support levels to watch are $1594 which is a 14-3 day raw stochastic at 50%, and $1637 at which the price crosses 9-day moving average stalls.

ETH has increased by 5.88% with a price change of 92.60$ in the past 24hrs and has a trading volume of 9.958 billion USD.

We can see an increase of 60.00% in the total trading volume in the last 24 hrs which is due to heavy buying seen at lower levels.

The Week Ahead

ETH has already made a failed attempt to cross the $1700 level by touching $1694 today. Now we are expecting a retest of the $1700 breach after which the next targets are located at $1800 and $1900 levels.

At present, the prices are moving in a consolidation channel above the $1650 level.

We can see the formation of a bullish ascending channel from $1535 towards the $1684 level.

The immediate short-term outlook for Ether has turned strongly bullish, the medium-term outlook has turned bullish, and the long-term outlook for Ether is neutral in present market conditions.

The resistance zone is located at $1701 which is the pivot point 2nd resistance level and at $1868 which is a 14-day RSI at 80%.

The weekly outlook is projected at $1800 with a consolidation zone of $1750.

Technical Indicators:

The relative strength index, RSI (14): is at 68.86 indicating a BUY

The moving average convergence divergence, MACD (12,26): is at 21.75 indicating a BUY

The average directional index: is at 23.83 indicating a BUY

The rate of price change: is at 22.11 indicating a BUY


Cryptocurrency CFDs are not available to retail clients in the UK

Disclaimer: CFDs are complex instruments and come with a high risk of losing your money.
I trade at FXOpen

User avatar
whiteking
rank: 150+ posts
rank: 150+ posts
Posts: 350
Joined: Fri Aug 11, 2017 2:25 am
Reputation: 32
Gender: None specified

Re: Daily analysis from FXOpen

Postby whiteking » Fri Feb 03, 2023 6:24 am

AUD/USD and NZD/USD Signals Downside Extension
Image

AUD/USD is correcting gains from the 0.7150 resistance zone. NZD/USD is also declining and reaching an important support at 0.6450.

Important Takeaways for AUD/USD and NZD/USD
  • The Aussie Dollar started a fresh decline from the 0.7150 resistance against the US Dollar.
  • There was a break below a key bullish trend line with support near 0.7080 on the hourly chart of AUD/USD.
  • NZD/USD also started a downside correction after it failed to clear 0.6540.
  • There is a connecting bullish trend line forming with support near 0.6440 on the hourly chart of NZD/USD.

AUD/USD Technical Analysis

The Aussie Dollar gained pace above the 0.7100 resistance zone against the US Dollar. The AUD/USD pair even spiked above the 0.7150 level before the bears appeared.

The pair traded as high as 0.7157 on FXOpen and started a fresh downside correction. There was a clear move below the 0.7120 and 0.7100 support levels. The pair declined below the 50% Fib retracement level of the upward move from the 0.6983 swing low to 0.7157 high.

Image

AUD/USD Hourly Chart

Besides, there was a break below a key bullish trend line with support near 0.7080 on the hourly chart of AUD/USD. The pair is now trading below 0.7080 and the 50 hourly simple moving average.

On the downside, an initial support is near the 0.7050 level. It is near the 61.8% Fib retracement level of the upward move from the 0.6983 swing low to 0.7157 high. The next support could be the 0.7000 level. If there is a downside break below the 0.7000 support, the pair could extend its decline towards the 0.6940 level.

On the upside, the AUD/USD pair is facing resistance near the 0.7080 level. The next major resistance is near the 0.7100 level.

A close above the 0.7100 level could start another steady increase in the near term. The next major resistance could be 0.7150.

Disclaimer: CFDs are complex instruments and come with a high risk of losing your money.
I trade at FXOpen

User avatar
whiteking
rank: 150+ posts
rank: 150+ posts
Posts: 350
Joined: Fri Aug 11, 2017 2:25 am
Reputation: 32
Gender: None specified

Re: Daily analysis from FXOpen

Postby whiteking » Mon Feb 06, 2023 5:36 am

GBP/USD Drops Sharply While EUR/GBP Gains Momentum
Image

GBP/USD started a fresh decline below the 1.2200 support zone. EUR/GBP is rising and trading above the 0.8920 support zone.

Important Takeaways for GBP/USD and EUR/GBP
  • The British Pound started a fresh decline from the 1.2400 resistance against the US Dollar.
  • There is a key bearish trend line forming with resistance near 1.2120 on the hourly chart of GBP/USD.
  • EUR/GBP started a steady increase above the 0.8900 and 0.8920 levels.
  • There is a major bullish trend line forming with support near 0.8945 on the hourly chart.

GBP/USD Technical Analysis
The British Pound started a major decline from well above the 1.2350 level against the US Dollar. The GBP/USD pair gained pace below the 1.2300 level to move into a bearish zone.

There was a clear move below the 1.2200 level and the 50 hourly simple moving average. The bears even pumped the price below the 1.2120 level and a low is formed near 1.2031 on FXOpen. It is now consolidating losses and trading below the 1.2100 level.

Image
GBP/USD Hourly Chart
On the upside, an initial resistance is near the 1.2100 level. The first major resistance is near the 1.2120 level. It is close to the 23.6% Fib retracement level of the downward move from the 1.2400 swing high to 1.2031 low.

There is also a key bearish trend line forming with resistance near 1.2120 on the hourly chart of GBP/USD. A clear move above the 1.2120 level could spark a decent increase.

The next major resistance sits near the 1.2215 level or the 50% Fib retracement level of the downward move from the 1.2400 swing high to 1.2031 low. Any more gains might send the pair towards the 1.2250 resistance zone.

On the downside, an initial support is near the 1.2030 level. The next major support is near the 1.2000 level. Any more losses could lead the pair towards the 1.1920 support zone.

Disclaimer: CFDs are complex instruments and come with a high risk of losing your money.
I trade at FXOpen

User avatar
whiteking
rank: 150+ posts
rank: 150+ posts
Posts: 350
Joined: Fri Aug 11, 2017 2:25 am
Reputation: 32
Gender: None specified

Re: Daily analysis from FXOpen

Postby whiteking » Tue Feb 07, 2023 4:29 pm

BTCUSD and XRPUSD Technical Analysis – 07th FEB 2023
Image

BTCUSD – Bullish Harami Pattern Above $22658

Bitcoin continues its bullish momentum from last week and after touching a low of $22658 on 07th Feb, the prices started to correct upwards against the US Dollar and are now ranging above the $23000 handle in the European trading session today.

The price is back over the Pivot point in the daily timeframe indicating bullish trends.

We can clearly see a bullish Harami pattern above the $22658 handle which is a bullish reversal pattern because it signifies the end of a downtrend and a shift towards an uptrend.

Bitcoin touched an intraday low of 22658 in the Asian trading session and an intraday high of 23037 in the European trading session today.

The momentum indicator is back over zero in the 4-hourly timeframe indicating a bullish scenario.

The MACD indicator is giving a bullish divergence signal in the 1-hourly timeframe.

Both the STOCH and STOCHRSI are indicating overbought levels which means that in the immediate short-term a decline in the prices is expected.

The RSI indicator is back over 50 in both the 30-minutes and 1-hourly timeframe indicating bullish trends.

Relative strength index is at 58.15 indicating a strong demand for Bitcoin, and the continuation of the buying pressure in the markets.

Bitcoin is now moving below its 100 hourly Simple Moving average and below its 100 hourly Exponential Moving averages.

Most of the major technical indicators are giving a BUY signal, which means that in the immediate shor-term we are expecting targets of 23500 and 24500.

Average true range is indicating less market volatility with a mild bullish momentum.
  • Bitcoin bullish continuation seen above $22658.
  • The Williams percent range is indicating an overbought level.
  • The price is now trading just above its Pivot levels of $22887.
  • Short-term range is mild bullish.
Bitcoin Bullish Continuation Seen Above $22658
Image

The prices of Bitcoin witnessed a downwards correction after crossing the $24000 levels. Now the markets are ranging into a consolidation channel above the $22500 handle.

After the consolidation phase is over, we are expecting upside moves in the range of $23500 to $24500 levels.

We can see the formation of a bullish price crossover pattern with the Adaptive Moving average AMA20 in both the 30-minutes and 1-hourly timeframes.

The immediate short-term outlook for Bitcoin is mild bullish, medium-term outlook has turned as bullish, and the long-term outlook remains neutral under present market conditions.

Bitcoin support zone is located at $22342 which is a 14-3 Day Raw Stochastic at 50% and at $22581 which is a 3-10 Day MACD Oscillator Stalls.

The price of BTCUSD is now facing its classic resistance levels of 23053 and Fibonacci resistance levels of 23352 after which the path towards 23500 will get cleared.

In the last 24hrs BTCUSD has increased by 0.84% by 190.97$ and has a 24hr trading volume of USD 24.800 Billion. We can see an increase of 13.07% in the trading volume as compared to yesterday, which appears to be normal.

The Week Ahead

Bitcoin has reached its highest levels this month at $24209 which was last seen on 20th Aug, 2022. We are now looking to cross the $25000 levels this month.

Daily RSI is printing at 62.55 which indicates a very strong demand for Bitcoin and the continuation of the bullish phase present in the markets in the short-term range.

We can see the formation of a bullish trendline from $22658 towards the $24118 levels.

The prices of BTCUSD are now facing its resistance zone located at $23406 which is a 14-Day RSI at 70% and at $23594 at which the price crosses 9-Day Moving Average Stalls.

Weekly outlook is projected at $25000 with a consolidation zone of $24000.

Technical Indicators:

Moving Averages Convergence Divergence (12,26): It is at 2.60 indicating a BUY.

Ultimate Oscillator: It is at 57.18 indicating a BUY.

Rate of Price Change: It is at 0.226 indicating a BUY.

Bull/Bear Power (13): It is at 175.73 indicating a BUY.

Cryptocurrency CFDs are not available to retail clients in the UK

Disclaimer: CFDs are complex instruments and come with a high risk of losing your money.
I trade at FXOpen

User avatar
whiteking
rank: 150+ posts
rank: 150+ posts
Posts: 350
Joined: Fri Aug 11, 2017 2:25 am
Reputation: 32
Gender: None specified

Re: Daily analysis from FXOpen

Postby whiteking » Wed Feb 08, 2023 8:08 am

EUR/USD Reverses Gains While USD/JPY Aims Higher
Image

EUR/USD is correcting lower and trading below 1.0800. USD/JPY is rising and might aim more upsides if it stays above the 130.20 support.

Important Takeaways for EUR/USD and USD/JPY
  • The Euro started a downside correction from the 1.1035 resistance zone.
  • There is a key bearish trend line forming with resistance near 1.0750 on the hourly chart of EUR/USD.
  • USD/JPY is attempting a fresh increase above the 131.00 support zone.
  • There was a break above a major contracting triangle with resistance near 130.00 on the hourly chart.

EUR/USD Technical Analysis

This past week, the Euro gained pace above the 1.0950 resistance against the US Dollar. The EUR/USD pair even broke the 1.1000 and 1.1020 resistance levels.

However, the pair failed to surpass the 1.1035 level. A high was formed near 1.1033 and the pair started a fresh decline. There was a clear move below the 1.0950 support zone and the 50 hourly simple moving average.

Image
EUR/USD Hourly Chart
The pair even broke the 1.0850 support level. A low is formed near 1.0670 on FXOpen and the pair is now correcting losses. There was a move above the 1.0700 level.

On the upside, an immediate resistance is near the 1.0750 level. There is also a key bearish trend line forming with resistance near 1.0750 on the hourly chart of EUR/USD. The trend line is close to the 23.6% Fib retracement level of the downward move from the 1.1033 swing high to 1.0670 low.

The next major resistance is near the 1.0800 level. An upside break above 1.0800 could set the pace for another increase. In the stated case, the pair might visit 1.0850 or the 50% Fib retracement level of the downward move from the 1.1033 swing high to 1.0670 low.

Any more gains might send the pair towards 1.0920. If not, it could continue to move down. An initial support on the downside is near the 1.0700 level. The first major support is near the 1.0670 level.

The main support sits near the 1.0650 zone, below which the pair could start a major decline. In the stated case, the pair might dive towards the 1.0520 support zone.

Disclaimer: CFDs are complex instruments and come with a high risk of losing your money.
I trade at FXOpen

Please add www.kreslik.com to your ad blocker white list.
Thank you for your support.


Return to “forex”