-
Moderator: moderators

Please add www.kreslik.com to your ad blocker white list.
Thank you for your support.
Thank you for your support.

pp2 wrote:I appreciate your comments withnail, it all looks so logical drilled down from h4 to m1 and I really like the cleanliness of your charts.
This H4 supply has been tested three times now. From what I've read from RED's FF thread, the more times a zone has been tested means a lack of supply, possibly meaning price will blow through this zone to the upside.
But I also see a compression pattern into this zone on third test on the H4, H1, M30 etc... possibly indicating a 'likely' reversal.
Confusing but it would be good to hear your thoughts here.
And yes, it be good to have others participating on this thread.
Thanks again.
Thanks pp2 your most welcome, I too like the white charts been practising with them to get my eyes to adjust. Yes indeed this is a theory . But as you said in your post I just go with the flow - price shows me the way. If it Rejects the 4h supply (strong move out not a dribble). I wait for a low risk entry check risk:reward and protect myself with stop. I try to manage trade as far down as you can watching new supply zones and demand reactions. On a 5min small supply I would only take the first pullback but on a 4h I just watch what happens. Notice in past chart I also had a new level in my modified fib, 50% of supply zone. I look to see how deep the retrace penetrates. I have a new rule if last was over 50% line I don't take it.
This is what I did (3rd test of 4h supply):-

Time to start the christmas holidays so probably my last post for a while. Have a good christmas everyone. 2012 is going to be a great trading year see you then.
Cheers Withnail.
Last edited by withnail on Fri Dec 02, 2011 6:02 pm, edited 2 times in total.
1. Big loss, 2. Small Loss, 3. Big Win, 4. Small Win --- just prevent 1.

Withnail, your last black/green chart with the Z/line ? is actually a S & R line with S turned to R.
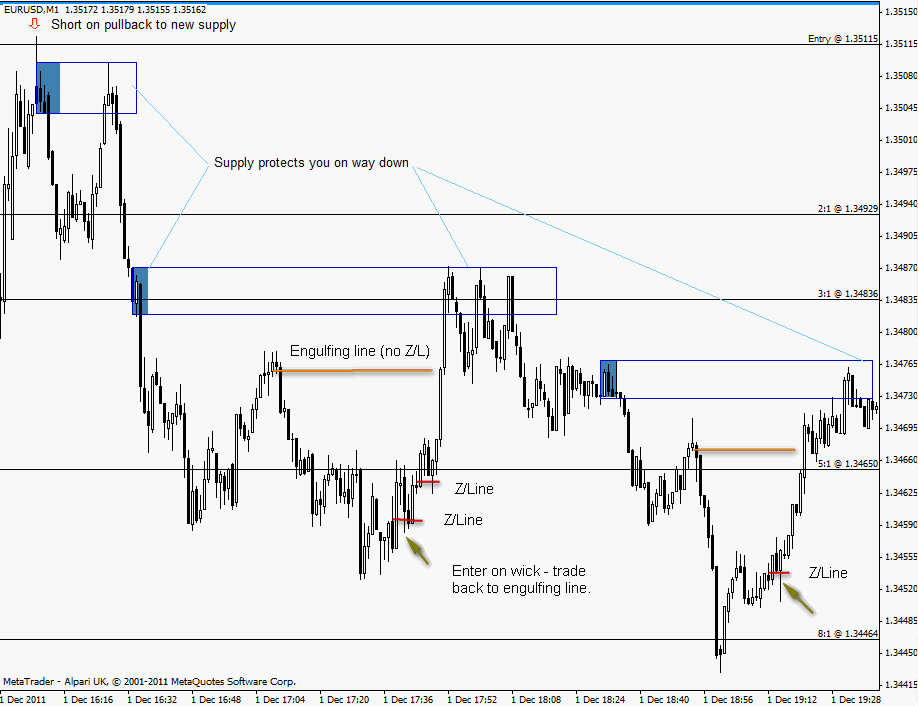
For Z/lines, think of a breakout trader entering on an engulfing bar with good memo. Seeing the memo they then move their stop to B/E. The next bar or two after the memo bar sees price go back and close out their trade at B/E, before continuing on in the direction of the memo bar.
For Z/lines, think of a breakout trader entering on an engulfing bar with good memo. Seeing the memo they then move their stop to B/E. The next bar or two after the memo bar sees price go back and close out their trade at B/E, before continuing on in the direction of the memo bar.
Is price closing higher or lower than something? Simple yet powerful question. ..MO
Please add www.kreslik.com to your ad blocker white list.
Thank you for your support.
Thank you for your support.
withnail wrote:Nice to see your charts pp2 but can you explain a bit?
(1) my entry, keeping in mind the bigger short picture, I took the engulfing bar (didn't close under something but still I thought worth it) after I see the rejection of the 15min extreme, small stop so worth the risk. I didn't see/know about the IB new supply which you showed in your other recent post around this level - something to keep in mind now and I have now added this to my trading arsenal, thank you.
(2) purple box 15 min supply
(3) yellow box 1 min supply
In the end I closed at BN 3400, didnt want to leave the trade over the weekend.
It occurred to me that maybe you wanted to keep your journal as simple as possible with just S and D. My trades have been accumulation of all the methods from kreslik like momo, zlines, rejections of extremes, blind mouse etc... --- so sorry about that, if I'm a nuisance let me know, no problem
withnail wrote:pp2 wrote:I appreciate your comments withnail, it all looks so logical drilled down from h4 to m1 and I really like the cleanliness of your charts.
This H4 supply has been tested three times now. From what I've read from RED's FF thread, the more times a zone has been tested means a lack of supply, possibly meaning price will blow through this zone to the upside.
But I also see a compression pattern into this zone on third test on the H4, H1, M30 etc... possibly indicating a 'likely' reversal.
Confusing but it would be good to hear your thoughts here.
And yes, it be good to have others participating on this thread.
Thanks again.
Thanks pp2 your most welcome, I too like the white charts been practising with them to get my eyes to adjust. Yes indeed this is a theory . But as you said in your post I just go with the flow - price shows me the way. If it Rejects the 4h supply (strong move out not a dribble). I wait for a low risk entry check risk:reward and protect myself with stop. I try to manage trade as far down as you can watching new supply zones and demand reactions. On a 5min small supply I would only take the first pullback but on a 4h I just watch what happens. Notice in past chart I also had a new level in my modified fib, 50% of supply zone. I look to see how deep the retrace penetrates. I have a new rule if last was over 50% line I don't take it.
This is what I did (3rd test of 4h supply):-
Time to start the christmas holidays so probably my last post for a while. Have a good christmas everyone. 2012 is going to be a great trading year see you then.
Cheers Withnail.
Have a nice and safe one withnail, see you when you get back.
Humble wrote:Not the best examples of Z/L but I hope it helps.
Thanks for the explanation and illustration Humble its appreciated. I am trying to do some homework on the methods used here in between the christmas celebrations. Z-lines are the first thing on my homework list.
Cheers Withnail.
1. Big loss, 2. Small Loss, 3. Big Win, 4. Small Win --- just prevent 1.
pp2 wrote:withnail wrote:pp2 wrote:I appreciate your comments withnail, it all looks so logical drilled down from h4 to m1 and I really like the cleanliness of your charts.
This H4 supply has been tested three times now. From what I've read from RED's FF thread, the more times a zone has been tested means a lack of supply, possibly meaning price will blow through this zone to the upside.
But I also see a compression pattern into this zone on third test on the H4, H1, M30 etc... possibly indicating a 'likely' reversal.
Confusing but it would be good to hear your thoughts here.
And yes, it be good to have others participating on this thread.
Thanks again.
Thanks pp2 your most welcome, I too like the white charts been practising with them to get my eyes to adjust. Yes indeed this is a theory . But as you said in your post I just go with the flow - price shows me the way. If it Rejects the 4h supply (strong move out not a dribble). I wait for a low risk entry check risk:reward and protect myself with stop. I try to manage trade as far down as you can watching new supply zones and demand reactions. On a 5min small supply I would only take the first pullback but on a 4h I just watch what happens. Notice in past chart I also had a new level in my modified fib, 50% of supply zone. I look to see how deep the retrace penetrates. I have a new rule if last was over 50% line I don't take it.
This is what I did (3rd test of 4h supply):-
Time to start the christmas holidays so probably my last post for a while. Have a good christmas everyone. 2012 is going to be a great trading year see you then.
Cheers Withnail.
Have a nice and safe one withnail, see you when you get back.
Thanks pp2, enjoying the holiday time but couldn't resist a look at the charts today
1. Big loss, 2. Small Loss, 3. Big Win, 4. Small Win --- just prevent 1.
In the new year I intend to mark up the important S&D levels on a sunday and maybe one day during the week. I plan to use the handy alerter.mq4 script to sms when price is with x pips of a nice level. AUDUSD levels of interest. Maybe Supply gets a retest this week.


Hope this is clear. Would have to zoom in to much to get it all on one chart. Interesting Supply is at 23.6 fibo if you draw it from may 2010 low to recent high. Cheers Withnail.
Hope this is clear. Would have to zoom in to much to get it all on one chart. Interesting Supply is at 23.6 fibo if you draw it from may 2010 low to recent high. Cheers Withnail.
1. Big loss, 2. Small Loss, 3. Big Win, 4. Small Win --- just prevent 1.
Please add www.kreslik.com to your ad blocker white list.
Thank you for your support.
Thank you for your support.