Well my pics were purdy, but wrong.
So I deleted 'em.
No point in confusing folks.
Moderator: moderators
poltergeist wrote:MO,
I have some questions. and correct me pls, if I am wrong:
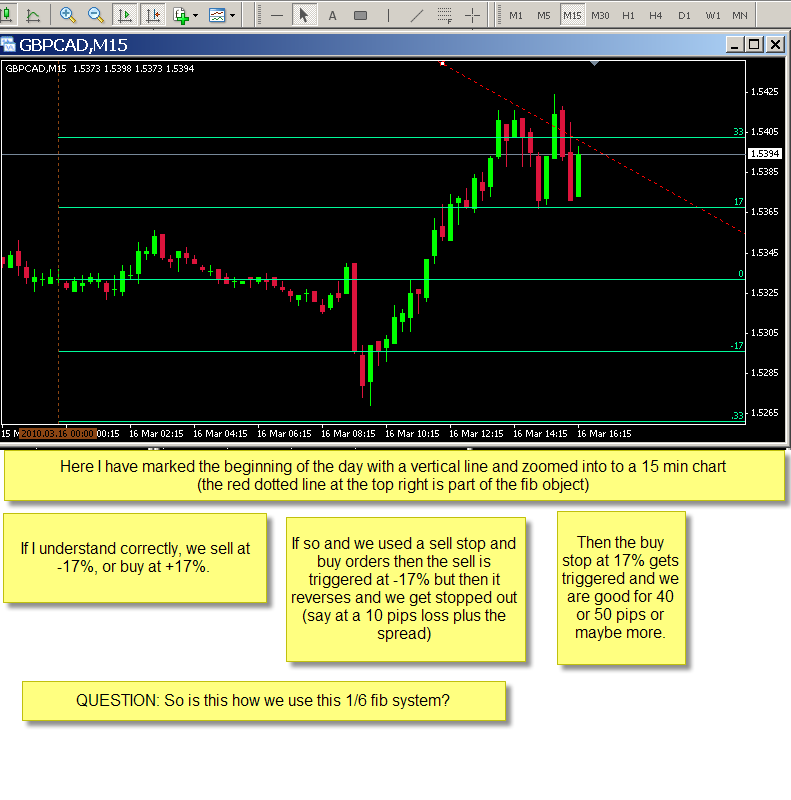
you enter the trade somewhere (without a precise entry point) beetween TPs? If you meet two consecutive SL, you are off till next week? How do you find the best moment to enter? The fibo level you mentioned?
Or you just enter the trade accordingly with the direction of the daily/weekly candle?
What's with the volatility on such big TF, how do you handle with it?
20 pips SL includes spread, I assume?
Or maybe I avoided sth?

noushina wrote:Hi MO.
I am not sure if I quite understand. Would you confirm or clarify please.
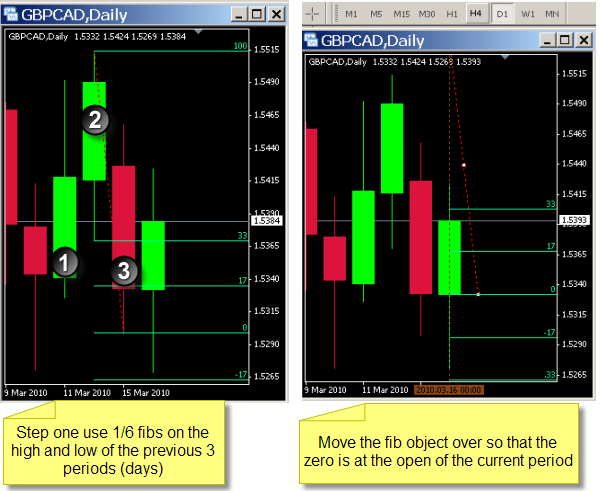
Below I have listed my understanding of how to use the 1/6 fib with daily charts.
I think that I am not clear on where on the new day I am to move the 1/6 fib object based on the previous three days. In the example below I place the zero point at the open of the new day. But someone else commented that it could be the current high or low of the new day.
Thank you.


tmanbone wrote:I thought we were dealing with weekly bars, set your fibs, then zoom in. Maybe I missed something.
noushina wrote:tmanbone wrote:I thought we were dealing with weekly bars, set your fibs, then zoom in. Maybe I missed something.
Thanks tman. Ya. I got confused and was looking at another thread where MO was explaining using 8 hour bars. So I was thinking be the same with daily bars
noushina wrote:Hi MO.
I am not sure if I quite understand. Would you confirm or clarify please.
Below I have listed my understanding of how to use the 1/6 fib with daily charts.
I think that I am not clear on where on the new day I am to move the 1/6 fib object based on the previous three days. In the example below I place the zero point at the open of the new day. But someone else commented that it could be the current high or low of the new day.
Thank you.