

Pro Trader wrote:MightyOne wrote:prochargedmopar wrote:In a predicament now.
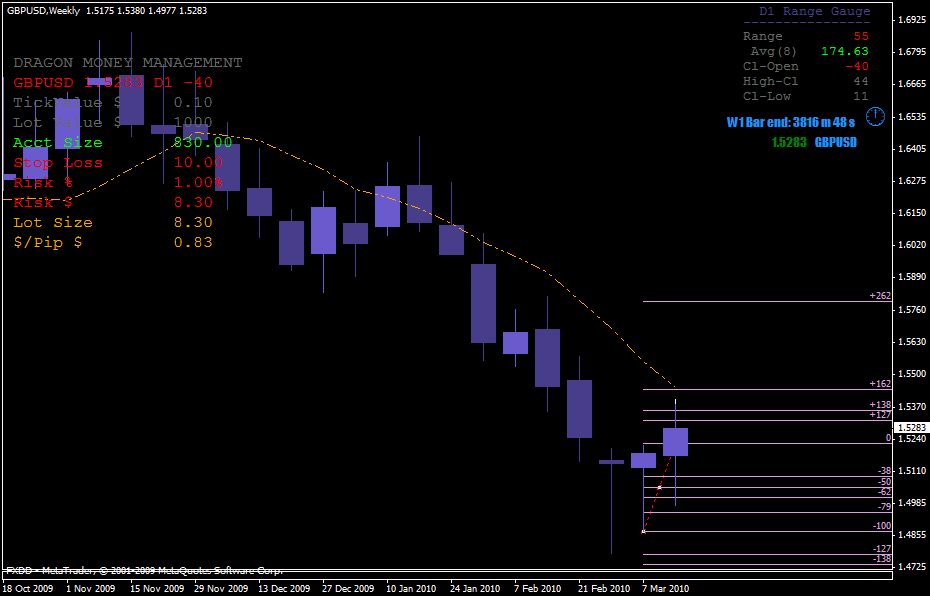
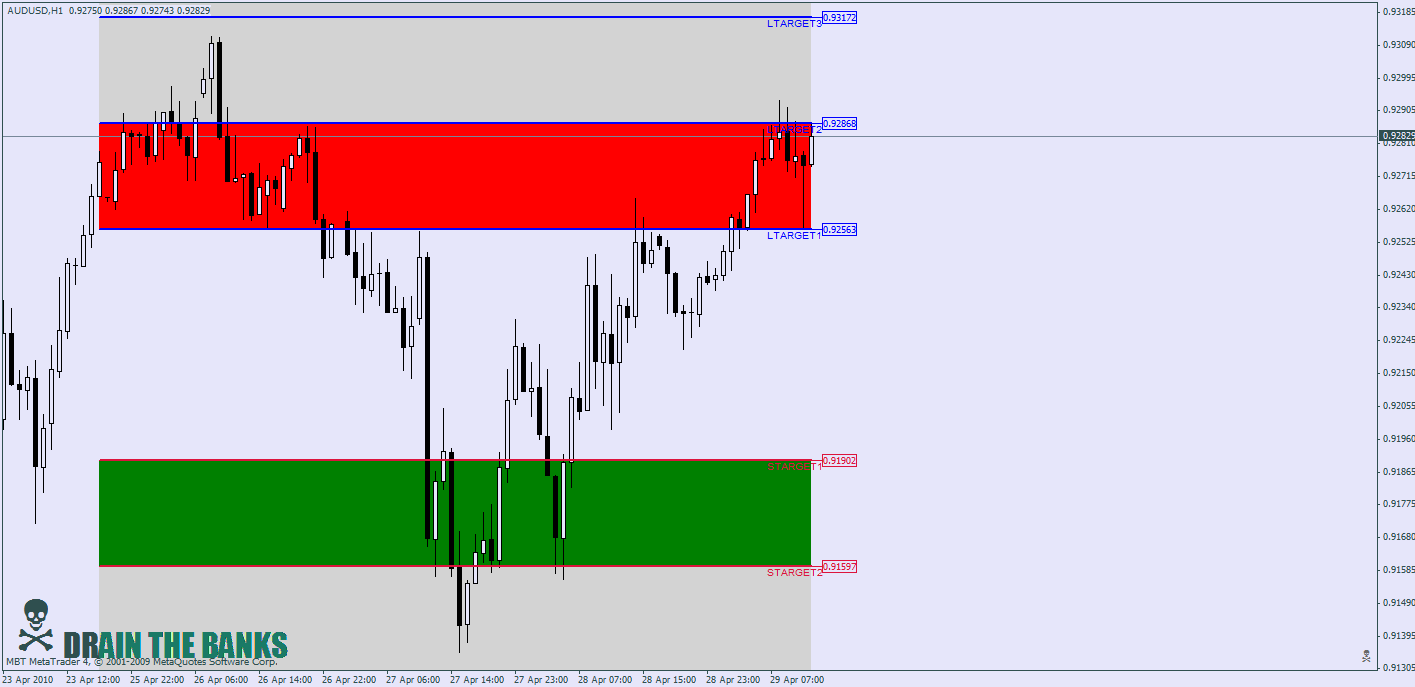
Price made it's low for week. Price broke into zone 1(tp 1) and now pulling back.
Long bias still after larger correction?
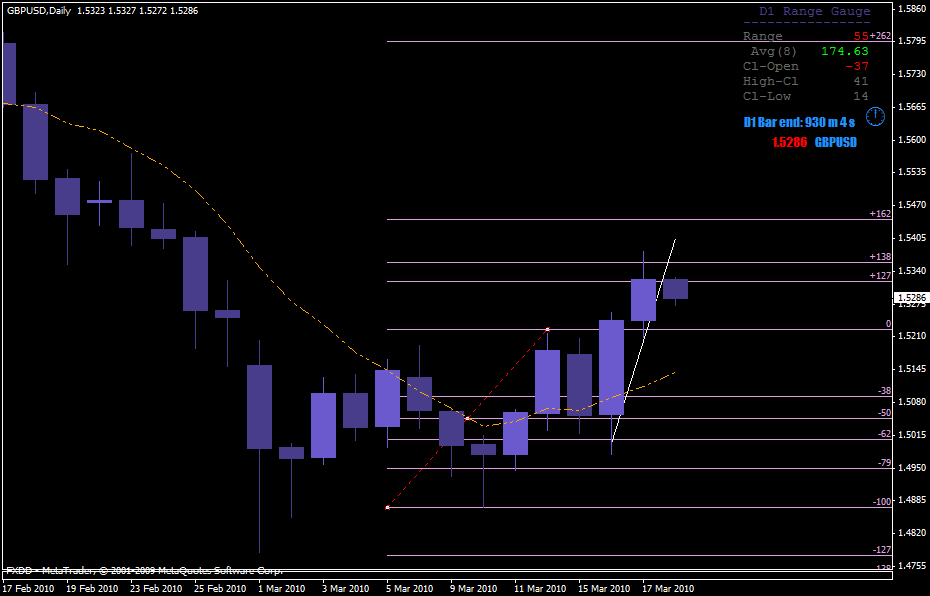
Daily
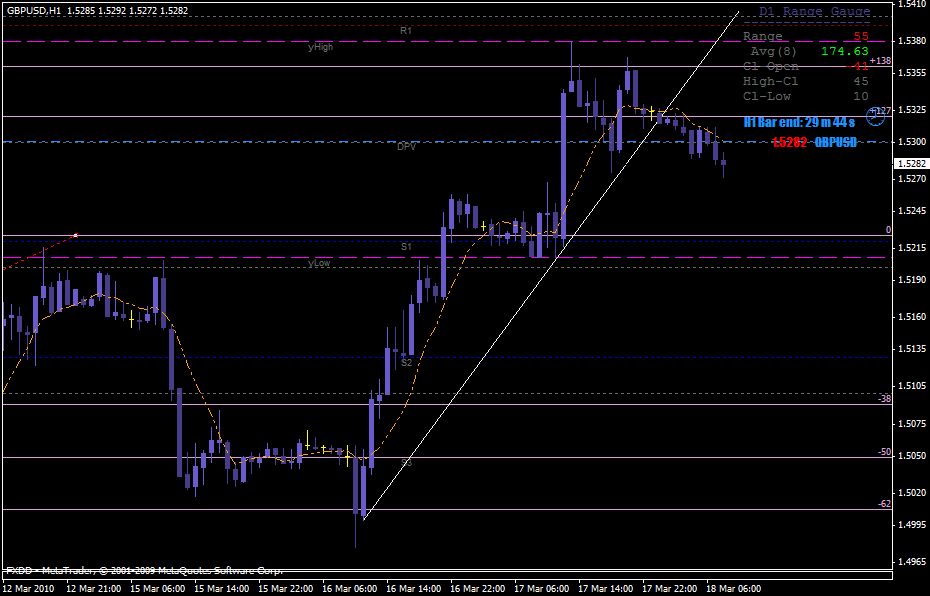
Hourly
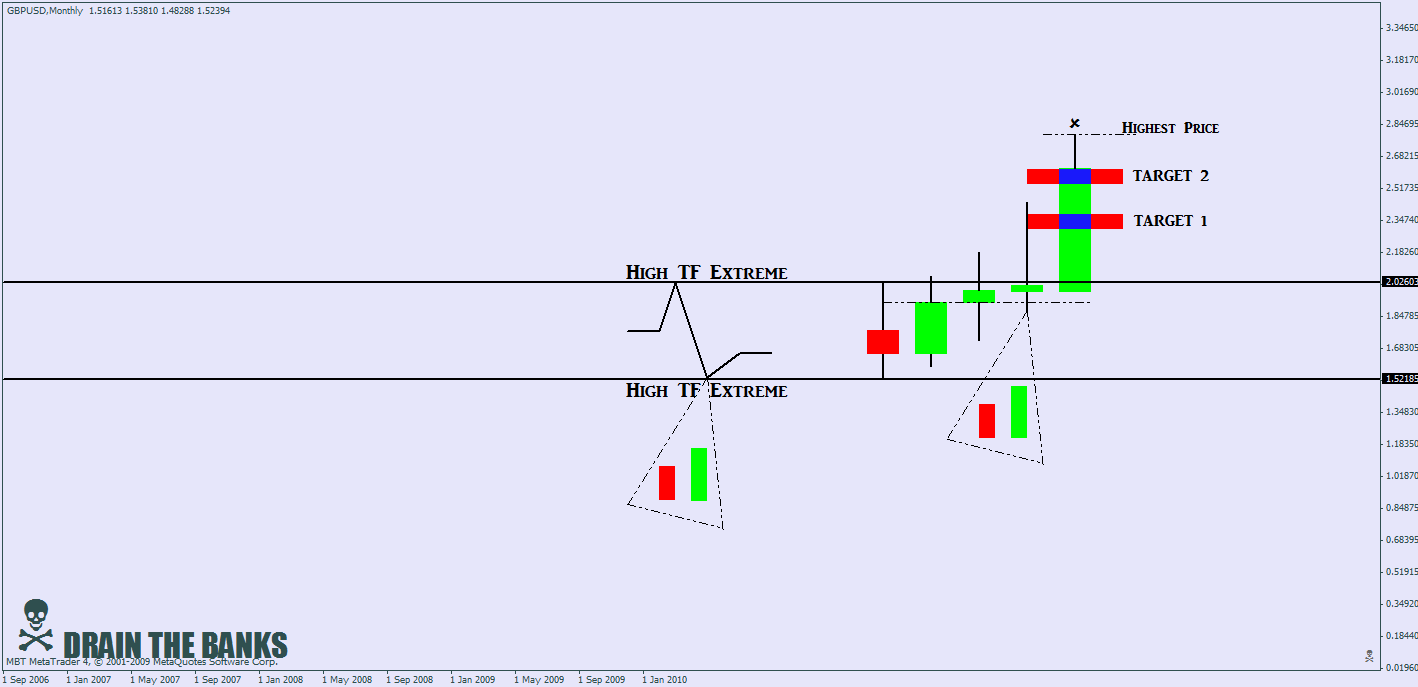
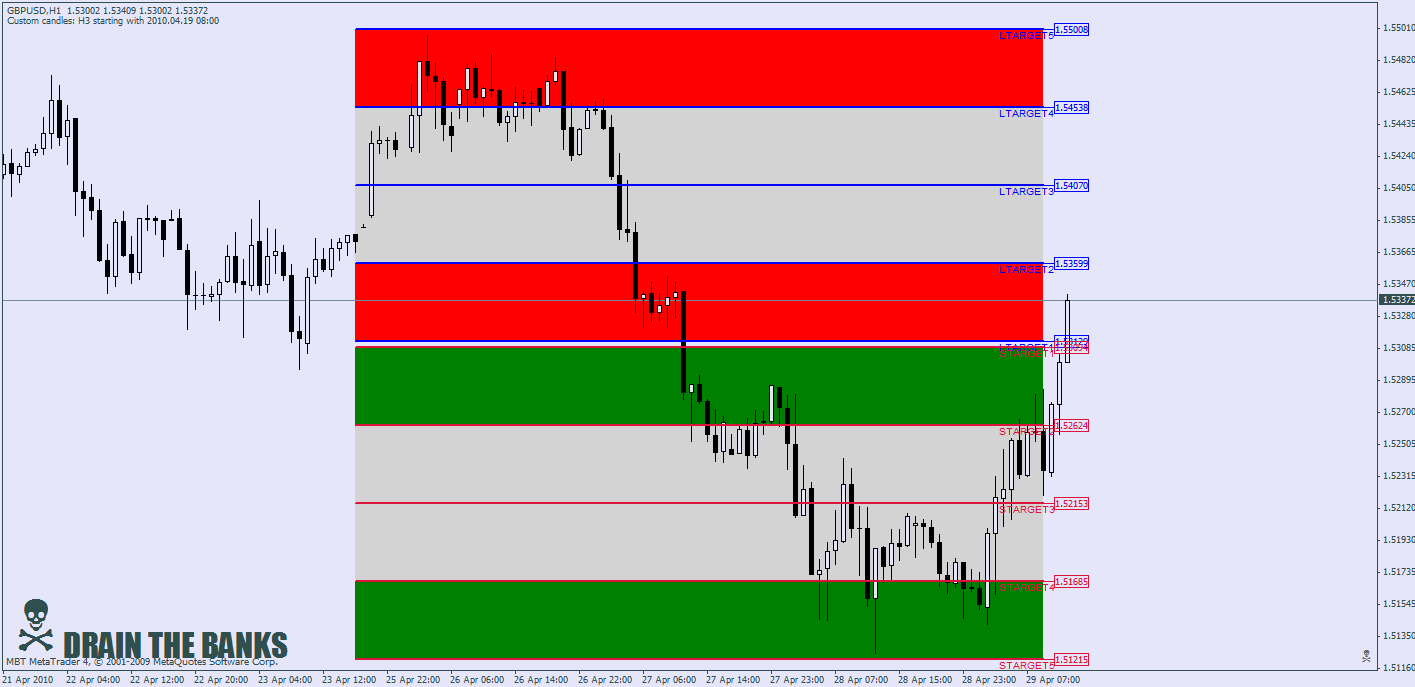
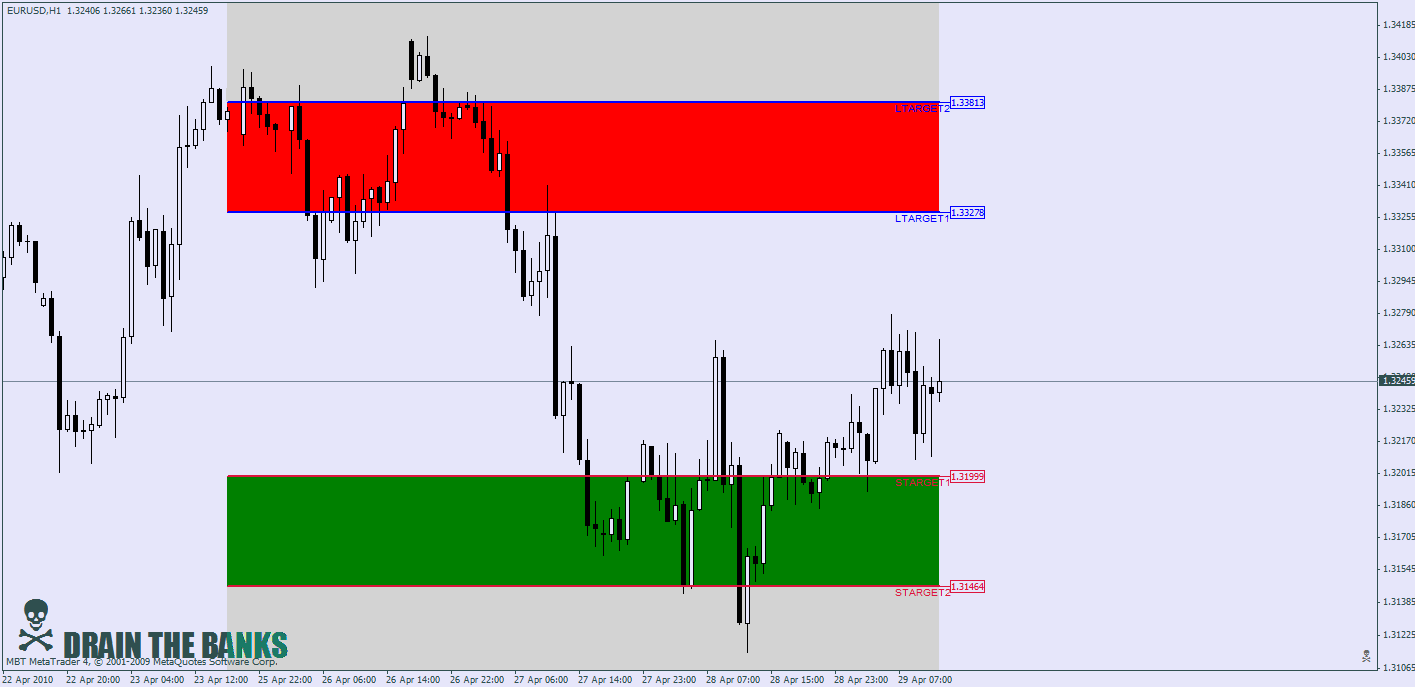
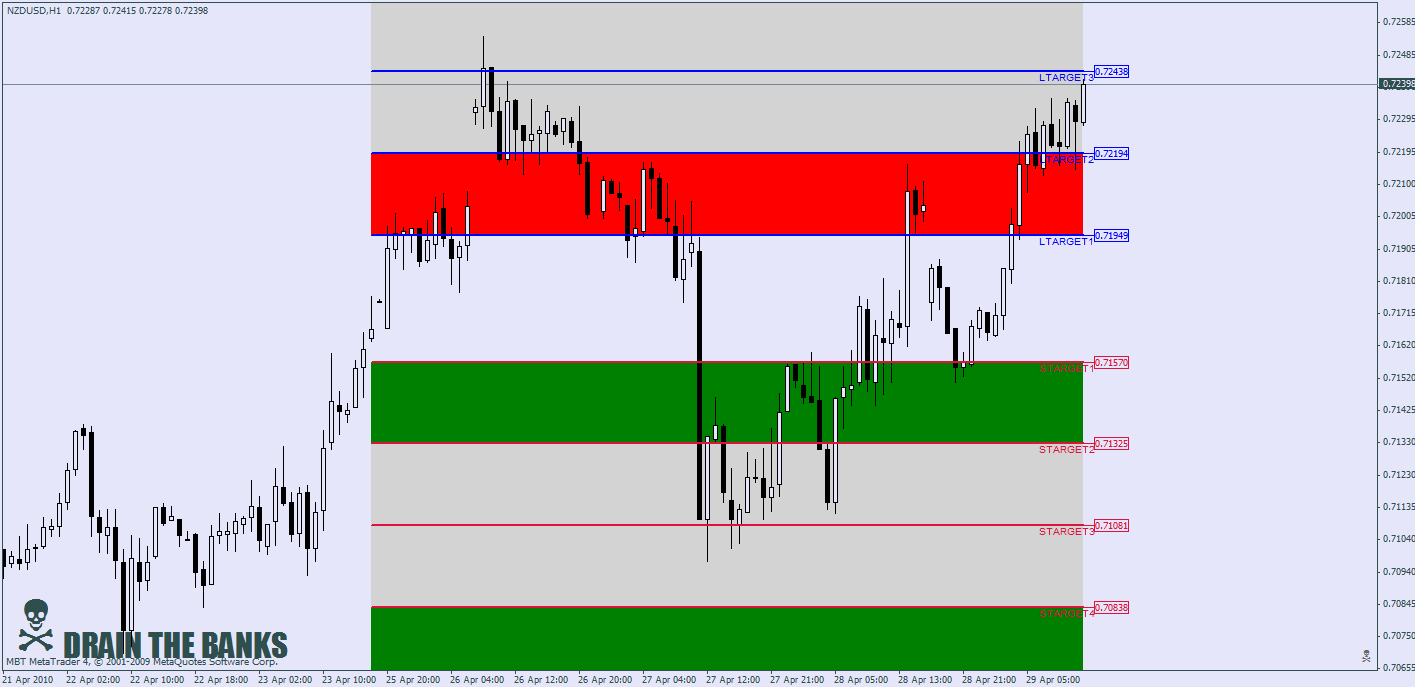
Targets do not create a bias, they are just there.
PRIORITY LIST:
1. High TF High/Low Extreme + Low TF PA
2. High TF Price Action
3. Targets
RULE OF THUMB:
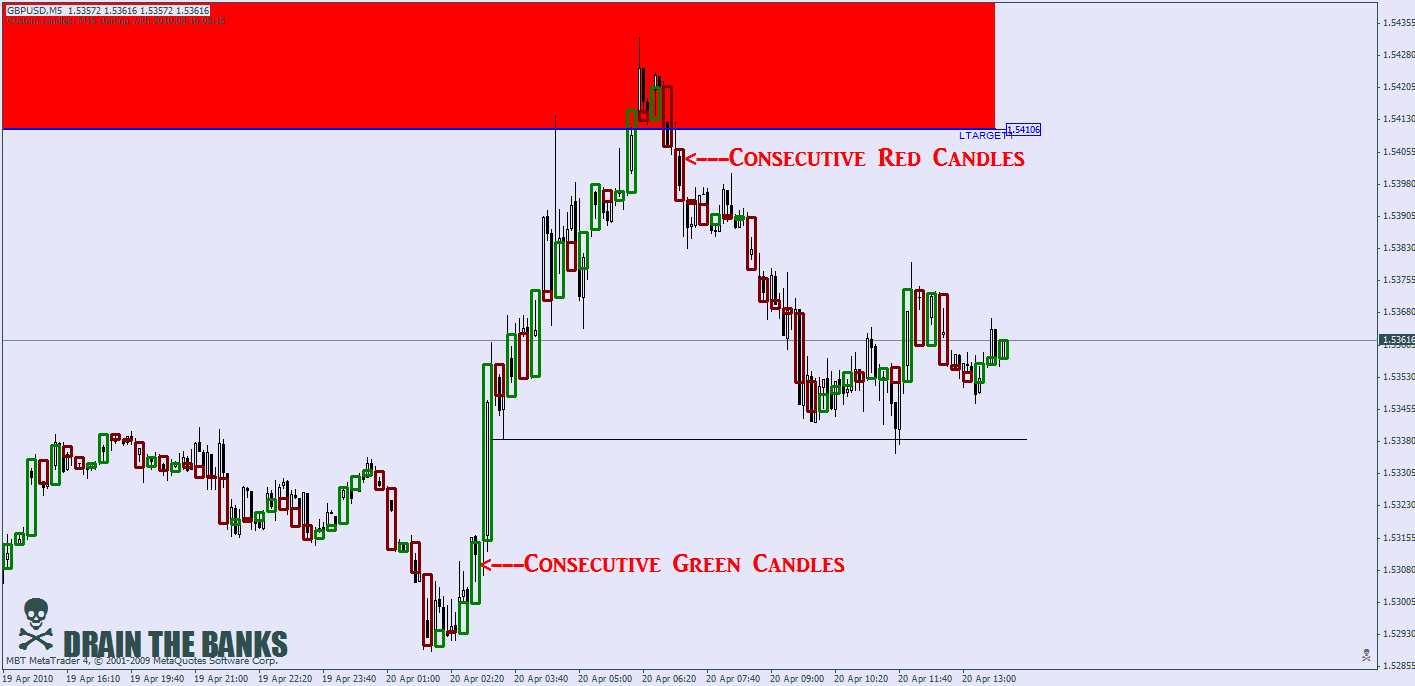
If price is consecutively closing higher then it cannot be closing below resistance.
Hi MO
I've been looking into the Crash Zone and I was wondering if you could advise me on some of the details.
With your rule of thumb regarding price consecutively closing higher, how do you define consecutively?
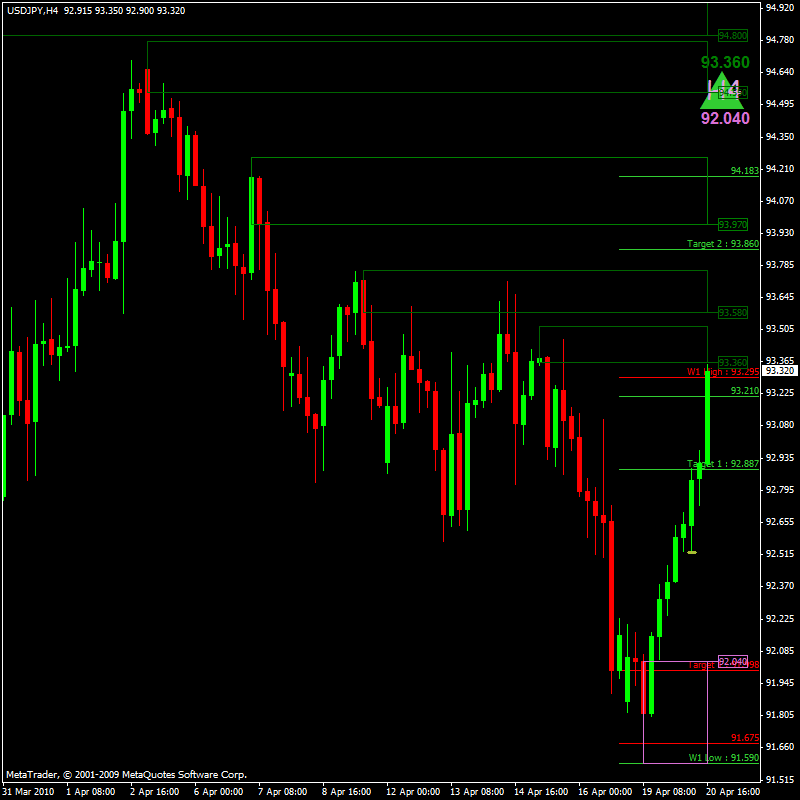
Looking at the UJ H4 chart below, I was at my screen by the time shown by the yellow line. Because the previous 5 candles were green, is that what constitutes consecutive in your books? Does there have to be a specifc number of previous same colour candles to qualify as consecutive.
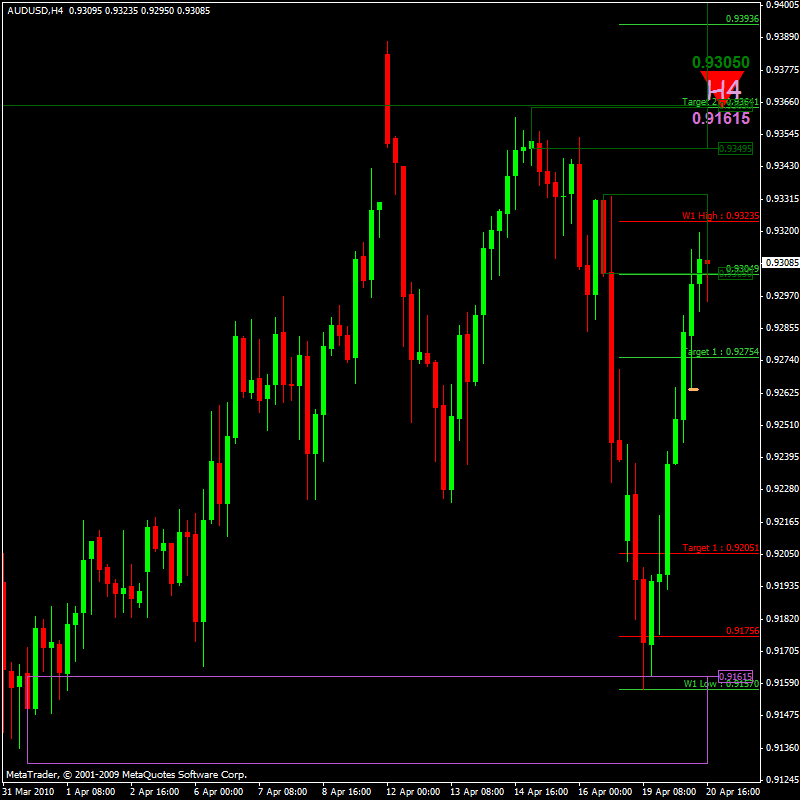
Similar thing on the chart below AUDUSD.
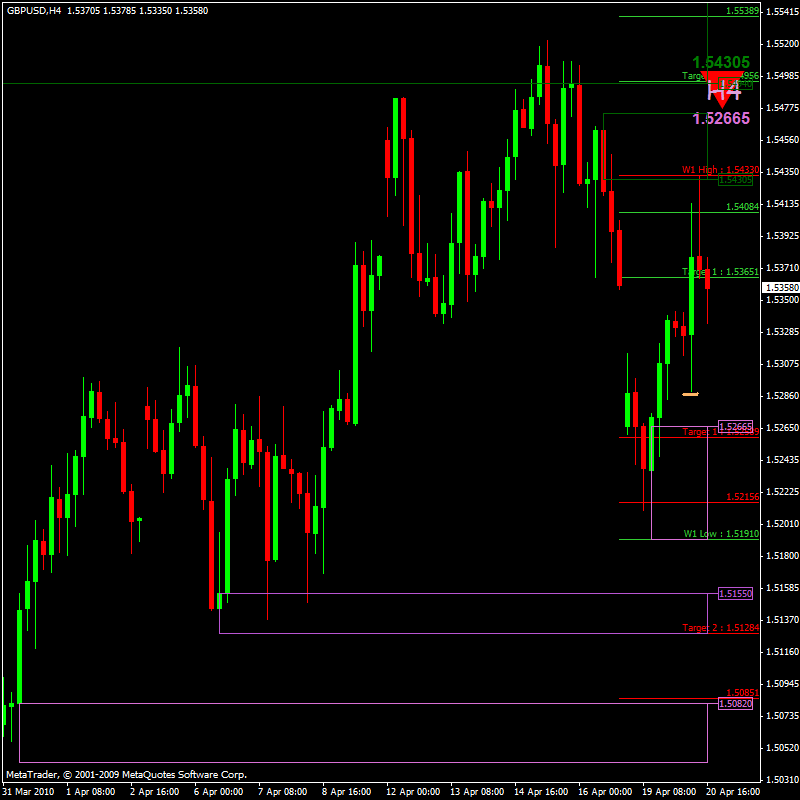
What about the GU H4 chart below. 2 red candles stopped the consecutive flow of green candles but price then went on to reach the 1st Target. Would you only take the trades on UJ and AUDUSD or is there something else I'm missing that would have confirmed trading GU to the 1st Target safely.
Price was within 20 pips of the Daily low on each pair at the times indicated. I'm just trying to work on how I could hold DTB Rat trades for longer.
Thank you for your time.
By combining 2 or 3 candles, starting with momo, you will find larger runs of both green and red candles.
You will forget all about target 1 when we start getting momentum on the weekly charts


