The HA close is roughly the same as the 2SMA.
Part of the strategy is a 6EMA pivot/2SMA(ish) crossover w/ color keeping you in the trend & inside candles or opposing color taking you out of the trend.
I am not looking to trade the current price but a POSITION on a large chart (D1, D3, D9).
Once I mark a position then my next question is whether or not I can afford the current price.
That is what smaller charts are for (30 minute, 3 minute, 150 seconds, 50 seconds, etc) to find ways to afford long term positions.
Accumulation takes place over a period of days or weeks.
On small charts, I am mainly just trying to improve my position and reduce risk though it never hurts to increase my size by 50% before taking a short term profit:
on small charts, while the color remains unchanged, my TP goes to the high extreme. if there is a change in color then I'll reduce size and set the TP on the open of the color change & if that doesn't get me out in 2 bars then I'll just liquidate.
REMEMBER that you are trading large charts from small charts!
Your ENTRY is your POSITION on a LARGE CHART & not the entry price of a small chart.
Where would you realistically place your stop on a large chart? Trade away from that price via a smaller chart ---> it is as simple as that!
News's Chin Stroke Delight
Moderator: moderators
Please add www.kreslik.com to your ad blocker white list.
Thank you for your support.
Thank you for your support.
- newscalper
- rank: 1000+ posts

- Posts: 1068
- Joined: Tue Oct 19, 2010 5:58 pm
- Reputation: 7
- Gender:

Thought I'd post this here rather than polluting Doji's thread.
Given up on the chin stumped candles, as with any MA cross it's done my head in
Anyway. On to this week's trade.
Given cable a miss as it's been killing me and found this instead, seems to have good moves. AUD/JPY. Although as I've found out they tend to be when I'm asleep.
Anyway, without further ado
I've chucked the Supdem indo on for ease of not having to draw them for this but by no means am I completely relying on it, it gives a good heads up though.
For those manually drawing zones I've found a nifty indy on FF, although I've yet to try it, that automatically extends your boxes to the right as the chart progresses. I'll post it up when I've given it a try.
So, AUD/JPY. On the timescales I'm looking at, in a solid downtrend but about to hit a rather iffy looking, old old, demand zone that you can just about make out on the weekly/daily. Definitely not a touch trade as it's counter the current trend.

Price didn't quite hit the marked area, with evidence of demand coming in just above it...so far so good, people willing to buy at that level.

You can just about see the upper line of the area that the indicator has picked out right at the bottom.
So what did I note? Had there been a good move way back when from the level, at least 2:1? Yes. Has it not been there for a while? Yes. Is it a fresh level? Yes. Is it a great level...hmmm, possibly not. The chart is also showing my first target which is the supply zone apparent on the H4 chart but the blue area is also my first trouble area. II Indy pulls this out on H1 but you can see it well enough anyway.
Down to M30 to look for an entry

And evidence of demand coming in after the first elipse but still to break supply to the upside...after having done that it looked like the level might become a swap (I didn't drill down) so I place a limit order and price promptly fell back down to the prior demand area.
Other considerations before placing the trade was if there was a 3:1 potential or more from where I was positioning from (below apparent support) to the first trouble area. There was so all's good.
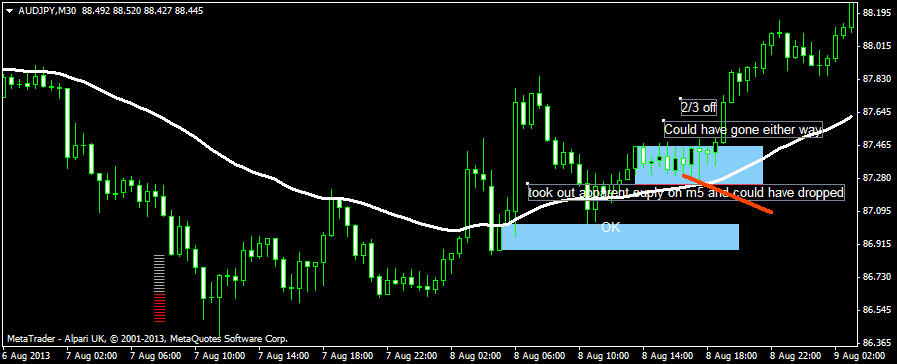
The plan was then to wait until price hit TA1 and take 2/3 off. That didn't go so well as I was asleep when it hit and hadn't used POs - I was going to do it manually. Great!
So when I awoke price had already hit the area and pulled back, so I watched to see if the newly formed demand areas held or not.

They did, however, after holding you can see an area of consolidation came about. which could have broken either way. Down on the M5 price was trapped between two areas, it was going deeper and deeper into the demand area and then broke through, so at that point I took 2/3 off as it could have had a clear run down from there. However, new demand came in and price started north again.
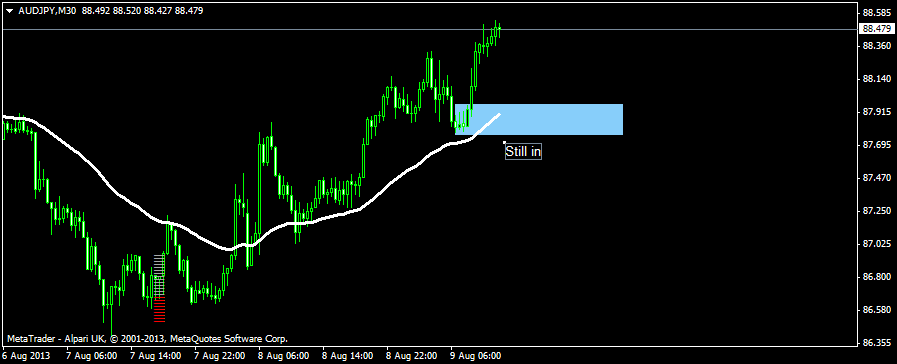
So still in the trade at this point. watching the demand levels. If the H4 supply level that price is now approaching breaches I'll consider adding back in at a suitable point in time.
If it holds I'll be out.

Given up on the chin stumped candles, as with any MA cross it's done my head in
Anyway. On to this week's trade.
Given cable a miss as it's been killing me and found this instead, seems to have good moves. AUD/JPY. Although as I've found out they tend to be when I'm asleep.
Anyway, without further ado
I've chucked the Supdem indo on for ease of not having to draw them for this but by no means am I completely relying on it, it gives a good heads up though.
For those manually drawing zones I've found a nifty indy on FF, although I've yet to try it, that automatically extends your boxes to the right as the chart progresses. I'll post it up when I've given it a try.
So, AUD/JPY. On the timescales I'm looking at, in a solid downtrend but about to hit a rather iffy looking, old old, demand zone that you can just about make out on the weekly/daily. Definitely not a touch trade as it's counter the current trend.

Price didn't quite hit the marked area, with evidence of demand coming in just above it...so far so good, people willing to buy at that level.

You can just about see the upper line of the area that the indicator has picked out right at the bottom.
So what did I note? Had there been a good move way back when from the level, at least 2:1? Yes. Has it not been there for a while? Yes. Is it a fresh level? Yes. Is it a great level...hmmm, possibly not. The chart is also showing my first target which is the supply zone apparent on the H4 chart but the blue area is also my first trouble area. II Indy pulls this out on H1 but you can see it well enough anyway.
Down to M30 to look for an entry

And evidence of demand coming in after the first elipse but still to break supply to the upside...after having done that it looked like the level might become a swap (I didn't drill down) so I place a limit order and price promptly fell back down to the prior demand area.
Other considerations before placing the trade was if there was a 3:1 potential or more from where I was positioning from (below apparent support) to the first trouble area. There was so all's good.
The plan was then to wait until price hit TA1 and take 2/3 off. That didn't go so well as I was asleep when it hit and hadn't used POs - I was going to do it manually. Great!
So when I awoke price had already hit the area and pulled back, so I watched to see if the newly formed demand areas held or not.

They did, however, after holding you can see an area of consolidation came about. which could have broken either way. Down on the M5 price was trapped between two areas, it was going deeper and deeper into the demand area and then broke through, so at that point I took 2/3 off as it could have had a clear run down from there. However, new demand came in and price started north again.
So still in the trade at this point. watching the demand levels. If the H4 supply level that price is now approaching breaches I'll consider adding back in at a suitable point in time.
If it holds I'll be out.

- newscalper
- rank: 1000+ posts

- Posts: 1068
- Joined: Tue Oct 19, 2010 5:58 pm
- Reputation: 7
- Gender:

Please add www.kreslik.com to your ad blocker white list.
Thank you for your support.
Thank you for your support.

