Eval account (Apex only these days) update:
Net +0.78%, cumulative +0.78, target 6%... back here again.
I was scalping using M1 ATR for sl/tp sizing and price at 12pm ET as Line in the Sand for bias.
The LiS wasn't very good because I could see the market was bid as it looked to grind up to the prior hour's high.. I took a few small losses that added up over the first hour; but I then noticed volume at 4433-4434 and no one buying the highs, so I got short at 4433 and scaled out at 2pts as price pushed lower and again at 4pts as price ran stops.
I then got back into scalping mode shorting and exiting as price pushed down from 4430 to 4427.
Price ran stops and volume came in at 4426-4426.50 forming a low and successive candles couldn't get within 2 ticks of the low.. I realised it was time to be long instead of being dogmatic.
I scalped in/out/add/out from 4428 to 4430, which got me nicely up for the day... it felt good to have a target (prior volume area) and to be confident in re-entering after scaling out.
Price got back towards the prior hour's high and apart from entering 1x lot short too soon, I got cautiously positioned again near the high 1x lot then added another 1x lot at the same price a little later.. then scaled out at 4 ticks and 6 ticks and called it a day... the 6 tick trade looked like me exiting at the low of a consolidation range, but price pushed lower a minute later which could have been a 14 tick trade instead.. oh well.
Learnings/to-do list:
- Be mindful of losing sight of the wood for the trees: hourly structure is very important and provides a context for executing.. price WILL travel distance over time
- Aim to get in at slightly better prices.. 1 tick better amounts to another point or two of net profit with these small scalps.
- "Position scalping" seems a viable approach: structural targets from H1, scalps on M1, running a core position (1x lot) over a longer period of time. A skill I need to develop; perhaps I can change SierraChart to use LIFO so my avg price looks correct.
- My net profit is higher than usual because I kept focusing on the session and not on my PnL.. I saw several opportunities and took them. I need to continue building confidence in trading towards the session close.
Lastly...
I've been a long-term DOM user because it can be useful to see what volume has traded a price.. but on ES I find it hard to keep track of levels.. either you get volume per-price-tap or session volume, so the details get blurred over time.
Recently I tried using a footprint chart (despite my reservations that these might just be gimmicks), which captures the bid/ask traded volume per-candle per-price.. it's UGLY, but I feel like it helped during this session to see whether volume was one-sided or balanced.. or whether stops fired at a price extreme..
Attached is the footprint chart I used today..
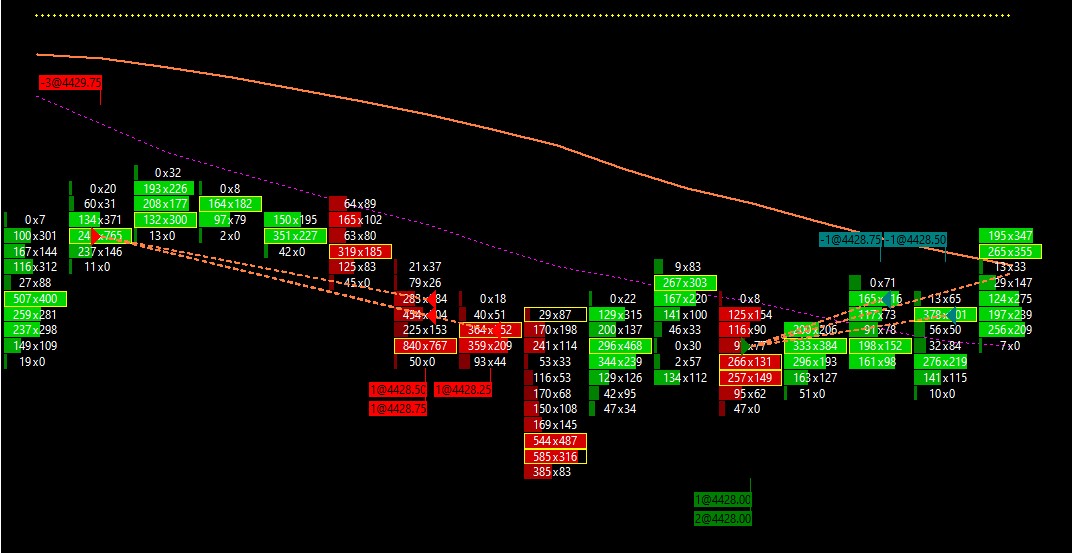
- 2023-11-14-footprint.jpg (118.83 KiB) Viewed 18405 times
That swing low on the chart is what I was referring to above: price never went near it again, volume built up above it and there was nice movement up away from it.


