Looking back is key I beleive. Look back.... Does price leave area in a hurry = momentum bar/momo bar/mbar
As long as the price hasn't come back to these areas yet you will watch these areas of interest.
When prices comes back and test the said areas does price again leave in a hurry.
Leave in hurry to me = wicking the zline of the said momentum bar/momo bar/mbar zline without showing any slowing down shooting away from zline areas....
If price shows you were wrong get out.
Price goes your way exit nearest opposite side zline.
Just thoughts for my journal. Have a good weekend guys.
Another NLA/Zline/Mbar Journal
Moderator: moderators
-
LegendofZline
- rank: 150+ posts

- Posts: 200
- Joined: Tue Jan 15, 2013 2:43 am
- Reputation: 60
- Gender:

Re: Another NLA/Zline/Mbar Journal
Last edited by LegendofZline on Sat Dec 02, 2017 12:42 am, edited 2 times in total.
Please add www.kreslik.com to your ad blocker white list.
Thank you for your support.
Thank you for your support.
-
LegendofZline
- rank: 150+ posts
- Posts: 200
- Joined: Tue Jan 15, 2013 2:43 am
- Reputation: 60
- Gender:
-
LegendofZline
- rank: 150+ posts
- Posts: 200
- Joined: Tue Jan 15, 2013 2:43 am
- Reputation: 60
- Gender:
Re: Another NLA/Zline/Mbar Journal
Ive been posting to much charts on doji's thread. gonna come back on here just because I feel I was spamming his thread.
But here I have a chart. If you look its same o thing price closes over under something then price wicks away. Let Price shows you where it wants to go.
But here I have a chart. If you look its same o thing price closes over under something then price wicks away. Let Price shows you where it wants to go.
-
LegendofZline
- rank: 150+ posts
- Posts: 200
- Joined: Tue Jan 15, 2013 2:43 am
- Reputation: 60
- Gender:
Re: Another NLA/Zline/Mbar Journal
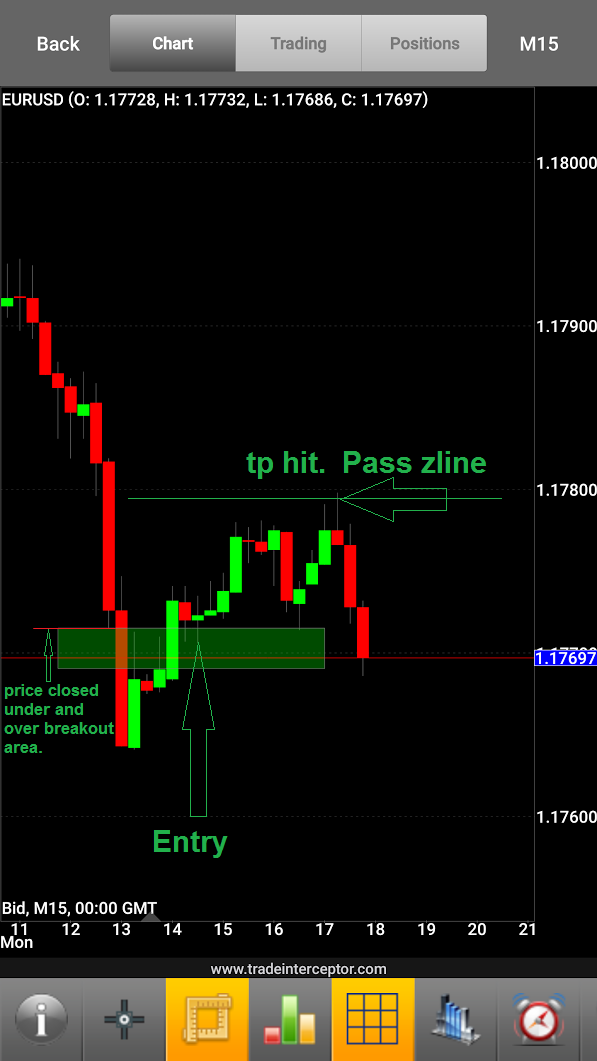
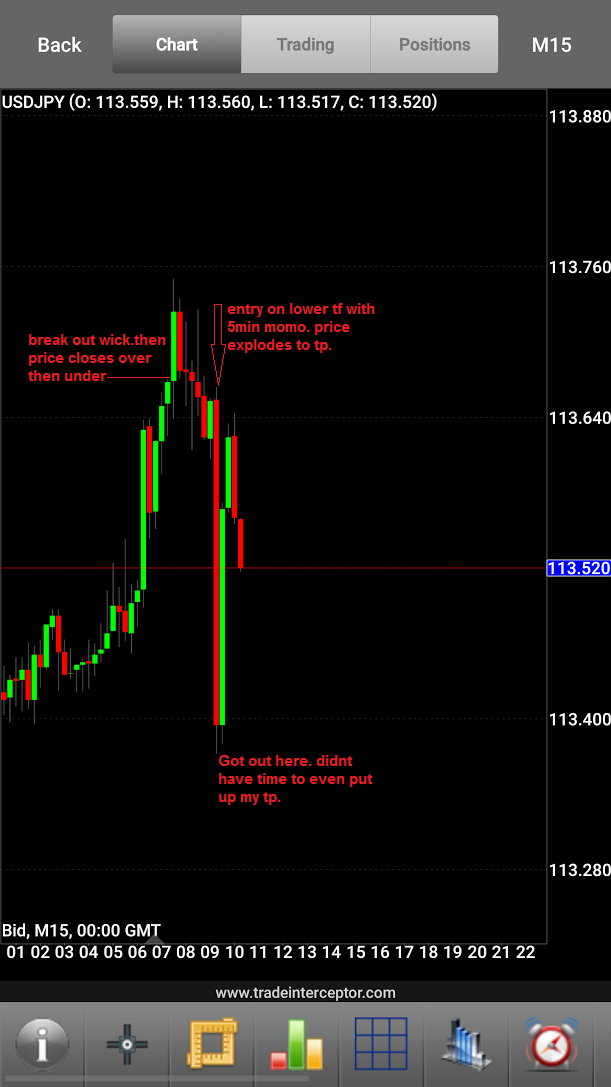
Here goes another one. 15min based price action closing over under.
Got in with 5min momo confirmation candle and the price exploded.
Closed short trade.
Again any insight on what I am doing right or wrong would be great!
Got in with 5min momo confirmation candle and the price exploded.
Closed short trade.
Again any insight on what I am doing right or wrong would be great!

Re: Another NLA/Zline/Mbar Journal
i understad NLA/RAT zone but , Can anyone please detail me the zline & momo strategy?
Plus, how are you combining them?
Plus, how are you combining them?
Please add www.kreslik.com to your ad blocker white list.
Thank you for your support.
Thank you for your support.
Re: Another NLA/Zline/Mbar Journal
i understand NLA/RAT zone but , Can anyone please detail me the zline & momo strategy?
Plus, how are you combining them?
Plus, how are you combining them?
-
LegendofZline
- rank: 150+ posts
- Posts: 200
- Joined: Tue Jan 15, 2013 2:43 am
- Reputation: 60
- Gender:
Re: Another NLA/Zline/Mbar Journal
Zline = area where you can see traders holding profit from a massive move. Where you say?
Any where price has sky rocketed away from leaving traders in the green for now. A momentum Candle. Or likemomo candle for short. Leaving you with Targets for you later to trade to zero those traders out. Or where you know traders will get out once price comes back to zero them out.
Momo = momentum candle closing 2x of previous candle and over extreme of previous candle.
As far as trading this style. There are a couple of ways of trading. Im still learning myself. But I will try To explain the way I trade or see things better on future charts
There are no defined rules but here's what I tend to look for.
1. A breakout or Momo happen,momentum etc. 1hr candle
2. Wait for candle close.
3. I wait for a reversal after this happens. Close above clove below action. (I will show in future charts) this is tricky but this is an area where I feel traders have gotten zeroed out and now closing there trades breaking making price react to exits by the masses only leaving price to sky rocket to next supply demand areas.
I am by far not a pro a this but this is what I get out of MO, doji, espip, dragon and tro's teachings. I will leave this open for the pros to chime in on my explanations if they are quite on point.
Cheers more charts to come.
Re: Another NLA/Zline/Mbar Journal
would you please demonstrate me a trade example with chart/picture?
-
LegendofZline
- rank: 150+ posts
- Posts: 200
- Joined: Tue Jan 15, 2013 2:43 am
- Reputation: 60
- Gender:
Re: Another NLA/Zline/Mbar Journal
Back at it. I have not been on for a while. I just want to see if there is any input.
zline trade - 4hr bias going up - 15 min zline 1 and 2 trade
any pointers would help.
stop loss if price isn't going my way. closed at next 15min mbar.
zline trade - 4hr bias going up - 15 min zline 1 and 2 trade
any pointers would help.
stop loss if price isn't going my way. closed at next 15min mbar.
- Attachments
-
- ZLINE.jpg (169.85 KiB) Viewed 9164 times


Re: Another NLA/Zline/Mbar Journal
LegendofZline wrote:Back at it. I have not been on for a while. I just want to see if there is any input.
zline trade - 4hr bias going up - 15 min zline 1 and 2 trade
any pointers would help.
stop loss if price isn't going my way. closed at next 15min mbar.
The first step is to define your risk based on how fast the small chart is moving through lines;
if each line represents 10% of your risk allowance (10%R) then how far apart would you set the lines?
If you had 10 pips to risk and you were down 1 then that would be -10%R, so each line is the same as
being +/- 1 pip.
Your lines shouldn't be so close together that you are up 20%R one moment and down 50%R the next,
you want to slow the markets role, make it sit down, and play the long game with it.
Instead of trying to maximize your reward per trade you should be focused on maximizing your lot size,
the reward per line, and getting more nutrition without taking larger bites out of the market.
The more you feel in control the better you will trade; someone who is down 5 pips probably had no say in the matter,
but by the time I am sitting at -20%R I probably had 2 or 3 opportunities to get out at -10%R and that makes all the
difference in the world.
The chart only exists to generate ideas; in the end you are just taking a trade at a line, risking a number of lines, and taking
lines or lines and a half as profit.
- risky+biz.png (85.94 KiB) Viewed 9152 times
"Everything Should Be Made As Simple As Possible, But Not Simpler!"
Please add www.kreslik.com to your ad blocker white list.
Thank you for your support.
Thank you for your support.