Humble wrote:Hi LoZ, I'm happy if I have got you interested in Z/L's again.
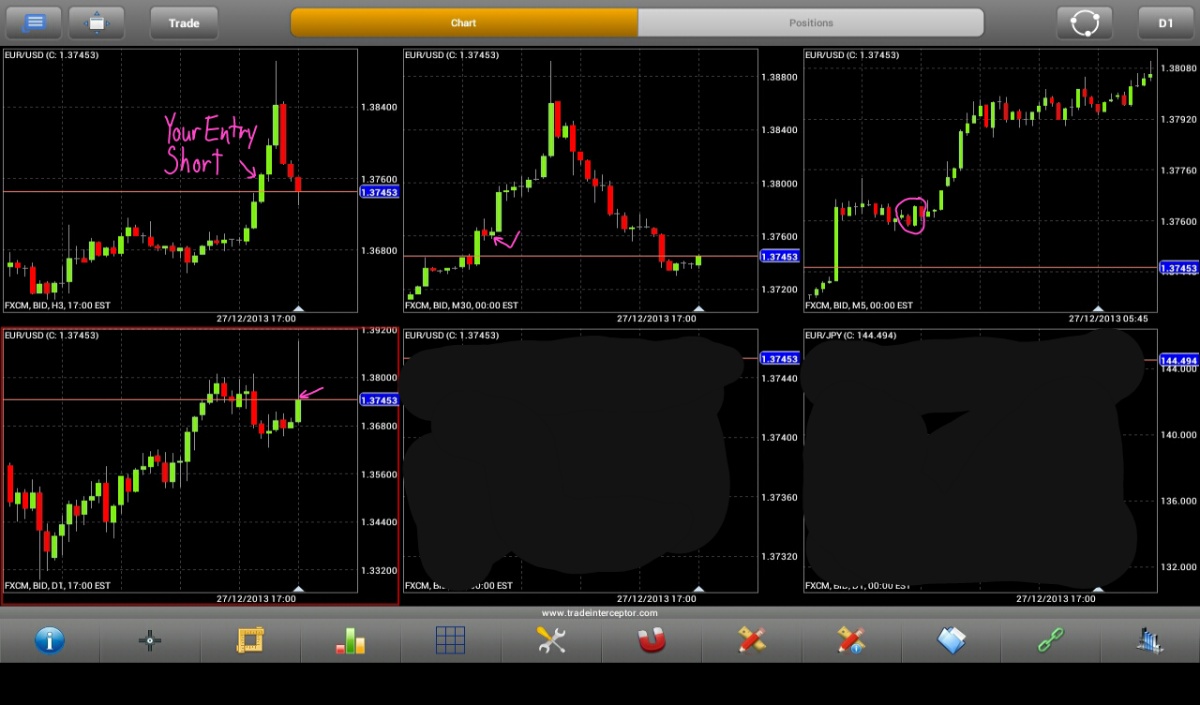
I originally post a chart to support the view of others that it is much easier to follow your thoughts if you can see them on a chart.
As you see on your chart marked with W and L's, there are usually many more W's than L's. However in practice many of the W's do not run far and result in BE trades (just making the spread). For this reason I prefer to use a H1 for bias and M15 for entries, but you must go with what you see.
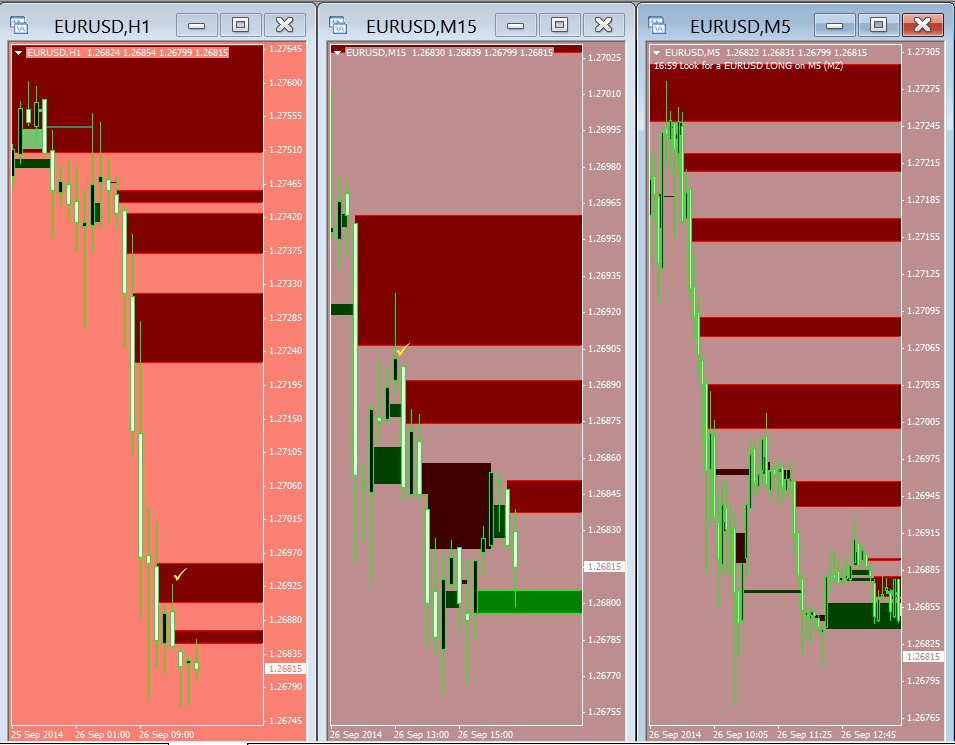
I didn't use any bias in giving the above examples. I just showed having one idea, Z/L break-out, and being consistent with the drawing of these lines.
Everyone sees Z/Ls differently and probably none as MO intended.
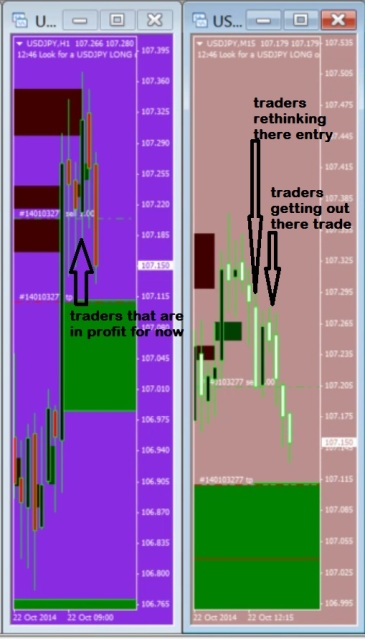
[highlight=red]I like to think of it in terms of a break-out trader, who enters a trade - moves stop to BE - price takes out the stop and then moves with the break-out.[/highlight]
What does this look like on a chart - a Z/L
So all the break-out traders help generate a memo bar. In the next bar or two price comes back and wicks the break-out line(s). You then look to trade with the memo.
If this is what's happening the Z/L can only be wicked, there is no reason for a bar to close beyound the Z/L. ie if we have a long set up, when price comes back to the break out area the only short entries there should be the break-out trades S/L (ie closing a trade), there should not be any trades entering a new short trade. That's why we have to wait for the wick bar to close.
If the Z/L is not wicked, then keep the line in place for a future target. As this profit will be taken eventually. I trade from a wicked Z/L to a Z/L that has not been wicked, as I see the idea is to eliminate other trades profit. This is what I think Mo is showing in the chart you posted.
Yeah, I used to look at them like that too. But think if that z-line isn't actually formed until that whole process has taken place. Then what's your perspective on it? (this is a rhetorical question