are these targets or trend reversals? they could be both.
If you are confused by one timeframe ie 1hr look to higher time frame 4hr and see what price is doing, has it hit anything ie 4hr mightyzone that might make you think stop n reverse.
Also look to your lower timeframe for clues as to what price is doing, do you have 15min zline to upside to indiciating that price maybe stopping and reversing/retracing.
so on my 4hr chart price just formed a 4hr momo to downside, so some retracement may be expected. But there is no evdience that price has hit any keylevels, we can say at moment price is down on 4hr.
On 15min there is no evidence of 15min zline to upside. so I remain with my bias to downside.
thats what i do.
Basically Use your full range of time frames to make an assessment of what price is doing.
Remember "THEY CAN FOOL YOU ON ONE TIMEFRAME, BUT THEY CAN'T FOOL YOU ON ALL 3." or something like that.
Hope that helps.
BB
newscalper wrote:
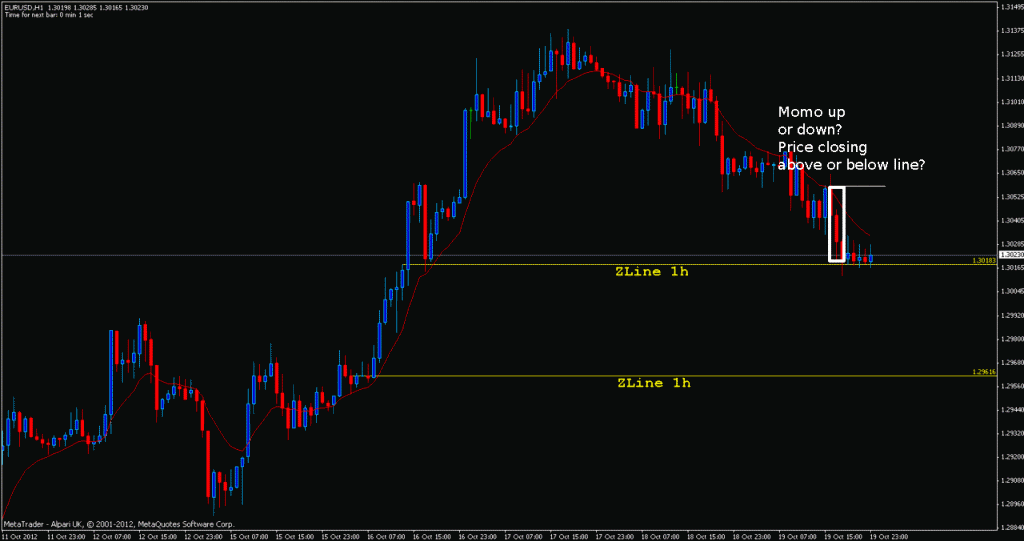
I still get as confused as you sometimes with this but what does this look like?
Are those zline levels targets or trend reversal areas?
If price is closing below the line they are targets/potential exits and momo is still down.