
Mira wrote:Es/Pip charts have always been weird to my eyes..
But today something it's happening (thank you Doji)!
I drew what I'm seeing (red lines) on one of his old charts.. what matters is that his yellow lines match exactly with the Doji setup.
IMG_2984.JPG
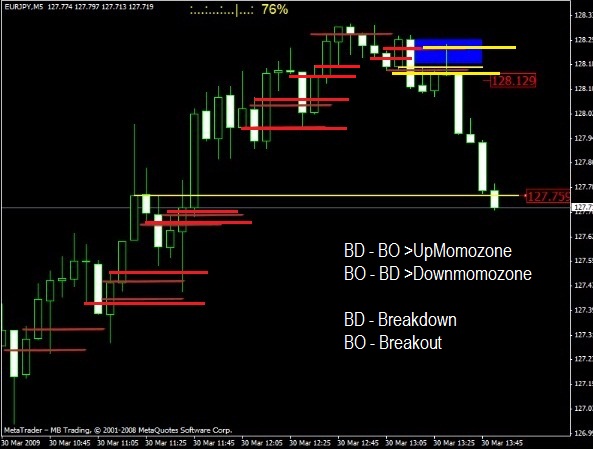
Thanks for posting this pic.It clears some doubts regarding when/how to change bias.No short until red UpMomozone is broken(No need to mark DownMomozone until this happens.)After Red Upmomozone is broken we start marking Yellow Downmomozone.
I used to mark both up and down zones at the same time and this led to big confusion.This stuff is getting clearer to see now.
I will go through epip posts again to solidify my new understanding over weekend.Thanks again.


 IS A LIE__________