tombarry wrote:Hey Doji
Did you saw my post on page 372?
I did, thanks.
..... I would have to think about that one.
...... Ok, I cant see that happening.
But never say never....
Sorry,
doji
Moderator: moderators


tombarry wrote:Hey Doji
Did you saw my post on page 372?
Mira wrote:dojirock wrote:Now were getting somewhere! Great effort Mira! A few of your lines are off.
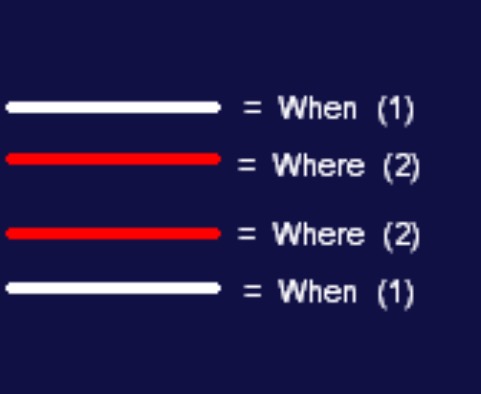
Bearish Mo takes a close below previous candles Low(extreme). Its this low that we draw the zline from which will pierce the body of the Momentum candle. The 2 candles together give us a green light on Bearish Momentum. Just the opposite from Bullish Momentum, and for that Momentum to be valid it also consist of 2 candles. So all in all a bearish Mo and bullish Mo consist of 4 candles. There can be non Mo candles between them. We are only looking at 1 time frame at this point.(overlays).
Were taking steps. Hopefully you guys can see them unfold as we go. Im trying to move quickly, but not to quick as to lose you.
- just a chart = odds are against us
- defined MO = slight improvement in odds
- defined two types of MO = even better odds yet
- using the two types of MO as one Momentum setup= Now the odds are surely in our favor!!
Ponder this........
Once we draw the 2 types of Momentum in this defined way(key being having to be defined, which was missing from the trading plan)
What if that became a zone?
Another key point, to back up that this works on any chart or time frame due to its the essence of PA......
Take a look at the custom candle indi. It doesnt matter what candles get grouped, the above will be visible!
doji
Thank you much for you help and your patience Doji.
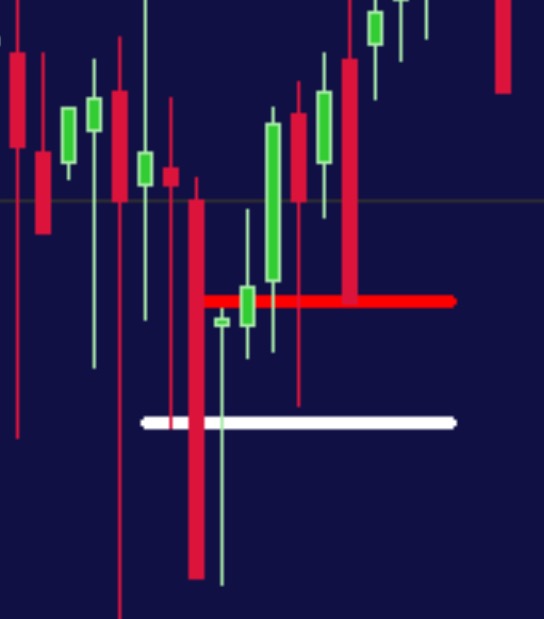
I'm following, I drew the lines better.. only one timeframe now!
IMG_2930.PNG

dojirock wrote:I would like to thank a special group of friends that have endured this journey with me. It has enabled me to try at least 5 different ways to express this view of price action in which they are all the same to me but didn't seem the same to them I know. To some of you this may seem weird that I taught via private chat room. The reality of it is, it makes me a better trader and has helped me keep focus. So i have benefited greatly. They will be joining us here at Kreslik due to I am no longer running the chat room. Some of my best ah-ha moments were here at Kreslik when there were many participating on a common idea.
doji
 IS A LIE__________
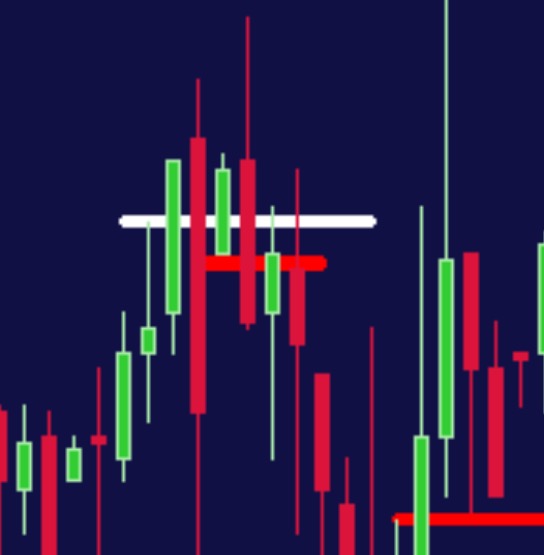
 Dillinger wrote:D Rock,
Are you more interested when a red candle breaks the green mo line (candle A) making the upper small area your zone you are looking for entry or when a red mo line completely closes below the green mo line (red arrow) making the lower zone your entry area?
Thanks for posting! I've learned a lot reading your thread and your ideas of defining exactly will help me with consistency

Dan wrote:question.png
Great to see you back Doji, been following this thread for years.
I was following your methods with ease up until a point where you just took off to another level and now everything is almost like mighty one style riddles (no offence, just not at your level yet).
The way I trade works if price is trending and in sideways markets I just give too much back, see chart.
Sorry for being slow to grasp this, maybe its the mighty zone indi habits that are a block for me.
I understand you are trading away from sema's 2 and 3 which is the same as a fractal and if that reversal fails it becomes a break out which can get in if price closes over? Is it that simple or am I way off?
 IS A LIE__________