I'm not sure I completely understand what you are doing with moving up the line when a new high is made by looking at your charts.
I think I got the gest of it but I got confused when I saw your charts.
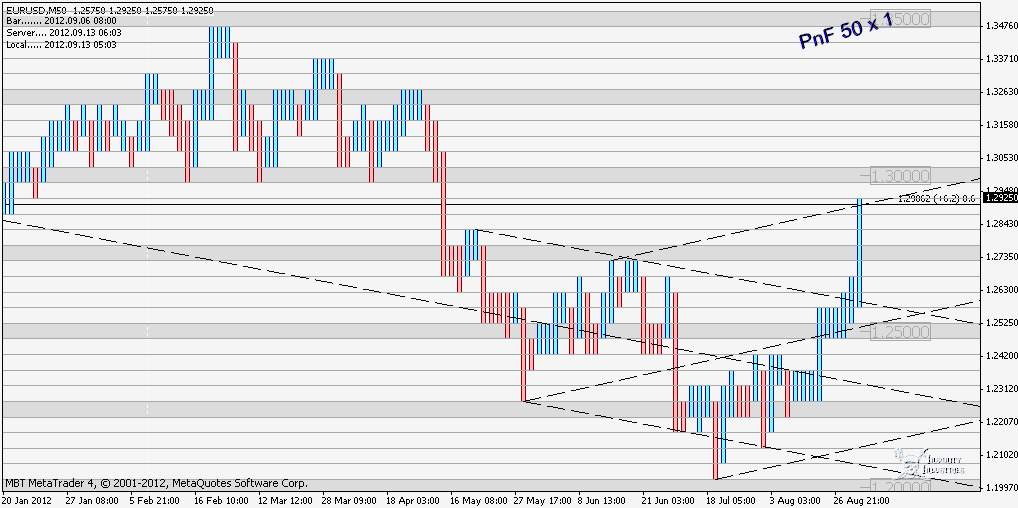
One suggestion in general is to only use horizontal lines with PnF. In the past we all have used different angles but what I have learned is that it doesn't make sense to use anything other than 45 degrees and to mostly stick with horizontal lines.
PnF I am looking at reversals which show up better than on a time based chart due to compression.
With regards to price hitting an angled line, my suggestion would be to use math to turn the chart into a horizontal channel where all you are looking for is price being at the bottom / top of the horizontal channel...than there is no need to deal with angles...
One last thing is you can use math to keep track of the cumulative count of up versus down boxes.
10 up
2 down
10 up
3 down
12 up
2 down
10 -2 = 8
8 + 10 = 18
18 - 3 = 15
15 + 12 = 27
27 - 2 = 25
It becomes 8, 18, 15, 27, 25
When the cumulative count becomes a certain low level it can tell you to get out, reverse, etc.
A fresh start! Doji's Trading Journal
Moderator: moderators
-
PebbleTrader

- rank: 1000+ posts

- Posts: 1633
- Joined: Fri Nov 12, 2010 2:15 am
- Reputation: 15
- Gender:

Please add www.kreslik.com to your ad blocker white list.
Thank you for your support.
Thank you for your support.
-
dojirock

- rank: 1000+ posts
- Posts: 1921
- Joined: Tue Nov 17, 2009 10:11 pm
- Reputation: 726
- Gender:

- Contact:
Tony Montana wrote:dojirock wrote:Yo...man...my kids read my thread.....
dojirock
Sorry doji I edited the post, just charts coming.
Thanks tony, no worry...lol
It always takes Momentum to break Momentum!
"A small loss is just as satisfying as a large gain" -MO
"Sometimes we need to stop learning and start thinking...."
"Once you stack, you'll never go back!"
"A small loss is just as satisfying as a large gain" -MO
"Sometimes we need to stop learning and start thinking...."
"Once you stack, you'll never go back!"
-
Tony Montana

- rank: 50+ posts

- Posts: 70
- Joined: Thu May 26, 2011 7:03 pm
- Reputation: 2
- Gender:

-
dojirock
- rank: 1000+ posts
- Posts: 1921
- Joined: Tue Nov 17, 2009 10:11 pm
- Reputation: 726
- Gender:
- Contact:
PebbleTrader wrote:I'm not sure I completely understand what you are doing with moving up the line when a new high is made by looking at your charts.
I think I got the gest of it but I got confused when I saw your charts.
One suggestion in general is to only use horizontal lines with PnF. In the past we all have used different angles but what I have learned is that it doesn't make sense to use anything other than 45 degrees and to mostly stick with horizontal lines.
PnF I am looking at reversals which show up better than on a time based chart due to compression.
With regards to price hitting an angled line, my suggestion would be to use math to turn the chart into a horizontal channel where all you are looking for is price being at the bottom / top of the horizontal channel...than there is no need to deal with angles...
One last thing is you can use math to keep track of the cumulative count of up versus down boxes.
10 up
2 down
10 up
3 down
12 up
2 down
10 -2 = 8
8 + 10 = 18
18 - 3 = 15
15 + 12 = 27
27 - 2 = 25
It becomes 8, 18, 15, 27, 25
When the cumulative count becomes a certain low level it can tell you to get out, reverse, etc.
Pt, I have included more charts to explain more of what im doing. After adding the cc to the pnf then applying the angles as I do, the challenge becomes a way to program it on one level to constantly be in the trade, one direction or the other...backtesting is proving phenomenal results. Writing the Ea to do it is another challenge.. but setting the ea aside for now, the advantage to drawing the angle per the last swing then taking the 45 degrees line off that is that it improves the success rate quite a bit. Using just the horizontal will get triggered for a reversal with often little chance of there being a profit to be made. The second problem with using just the horizontal is upon reversal the loss could be substantial verses using a angled line. Using strictly a 45 degree line is doable but not as effective as a adjusting, automatic angle deployer if you will. I will need to figure out the numbering system you gave as an idea to see how I could use that to figure the turning points...
I did plot more trades..each color coded...one line being the angle, the other being drawn 90 degrees to the other..which rest on the open of the cc until a new low is made then the line would self adjust to the open of that cc and so on until a break of that line which would then signal a reversal and the process repeats. I left the original lines on the chart and as it made new lows a new line was drawn instead of moving the other just so people could follow what im doing.
There are 2 charts one showing the pnf and one just showing the cc. By looking at the pnf you can see where the reversals occur (purple thick lines)
I have done this for over a year on time charts without the success potential it has using pnf and cc's. I still have not tried range bars, I need to get something that will draw those. Just had a thought..maybe renko also..
It might be a bit premeture but this I think has a potential for long term, set and forget or Ea potential.
dojirock
- Attachments
-
- d44.gif (18.51 KiB) Viewed 2442 times
It always takes Momentum to break Momentum!
"A small loss is just as satisfying as a large gain" -MO
"Sometimes we need to stop learning and start thinking...."
"Once you stack, you'll never go back!"
"A small loss is just as satisfying as a large gain" -MO
"Sometimes we need to stop learning and start thinking...."
"Once you stack, you'll never go back!"
Please add www.kreslik.com to your ad blocker white list.
Thank you for your support.
Thank you for your support.
-
dojirock
- rank: 1000+ posts
- Posts: 1921
- Joined: Tue Nov 17, 2009 10:11 pm
- Reputation: 726
- Gender:
- Contact:
I was helping a friend today and still amazes me how the trading books and programs out there teach us the wrong things to look at. After looking over 6 of the 7 losses he had on ES his long entries were all above the 12 ema and the short entries were all below the 12 ema, just like the books teach.......price crosses the ema...go that direction.
My number one rule..no exceptions is never take a long trade unless price is below the 12 ema (the one I use) and never take a short trade unless price is above the 12 ema.
Today on the 15min ES trading day, we took 3 trades giving a total of 28 points.... 3-0 today...he was elated....yet it was so simple. Of course we used levels in conjunction of the ema rule.
e/j examples below
dojirock
- Attachments
-
- kr1.gif (20.01 KiB) Viewed 2428 times
It always takes Momentum to break Momentum!
"A small loss is just as satisfying as a large gain" -MO
"Sometimes we need to stop learning and start thinking...."
"Once you stack, you'll never go back!"
"A small loss is just as satisfying as a large gain" -MO
"Sometimes we need to stop learning and start thinking...."
"Once you stack, you'll never go back!"
-
PebbleTrader
- rank: 1000+ posts
- Posts: 1633
- Joined: Fri Nov 12, 2010 2:15 am
- Reputation: 15
- Gender:
Why do you have 1 line on some, 2 lines on others and 3 lines on others?
I want to stress again that angles do not mean the same thing on PnF. We can draw angles on time based charts due to the continuity of time, however with PnF or the "time surgery" stuff I had talked about in the past, time is non continuous and angled lines have a different meaning. And that meaning is not one of a support/resistance meanings.
It can be very tempting to want to add angled lines on a PnF chart because it looks like a "chart", resist the temptation!
Another issue with MT4, PnF, is that the boxes are rarely square. You can only see a true square if you use the Excel version.
I mentioned the other ideas because that is a lot easier to code than what you are doing with lines. See if you can find a consistent low number where your reversals occur based on your line studies using the cumulative count from the swing point.
Life is just a journey

Please add www.kreslik.com to your ad blocker white list.
Thank you for your support.
Thank you for your support.