
Great work News.
Good to see you making progress
doji
A fresh start! Doji's Trading Journal
Moderator: moderators
Please add www.kreslik.com to your ad blocker white list.
Thank you for your support.
Thank you for your support.
-
newscalper

- rank: 1000+ posts

- Posts: 1068
- Joined: Tue Oct 19, 2010 5:58 pm
- Reputation: 7
- Gender:


-
newscalper
- rank: 1000+ posts
- Posts: 1068
- Joined: Tue Oct 19, 2010 5:58 pm
- Reputation: 7
- Gender:
Exactly. Now think how many in and outs between the extremes on H1/H4.
But it's not just that - it can give orientation. Go back to the monthly chart one - think in terms of GU. GU has been travelling in a range for HOW long.
In terms of bias etc if it's near an all time high or low and tend to range between those levels, if you were a rat which way would you trade? Red rat for sure if it's in the top 25% zone. Now drop to a lower TF chart and zone that one up again. Top 25% area, red rat. etc.

Please add www.kreslik.com to your ad blocker white list.
Thank you for your support.
Thank you for your support.
-
newscalper
- rank: 1000+ posts
- Posts: 1068
- Joined: Tue Oct 19, 2010 5:58 pm
- Reputation: 7
- Gender:
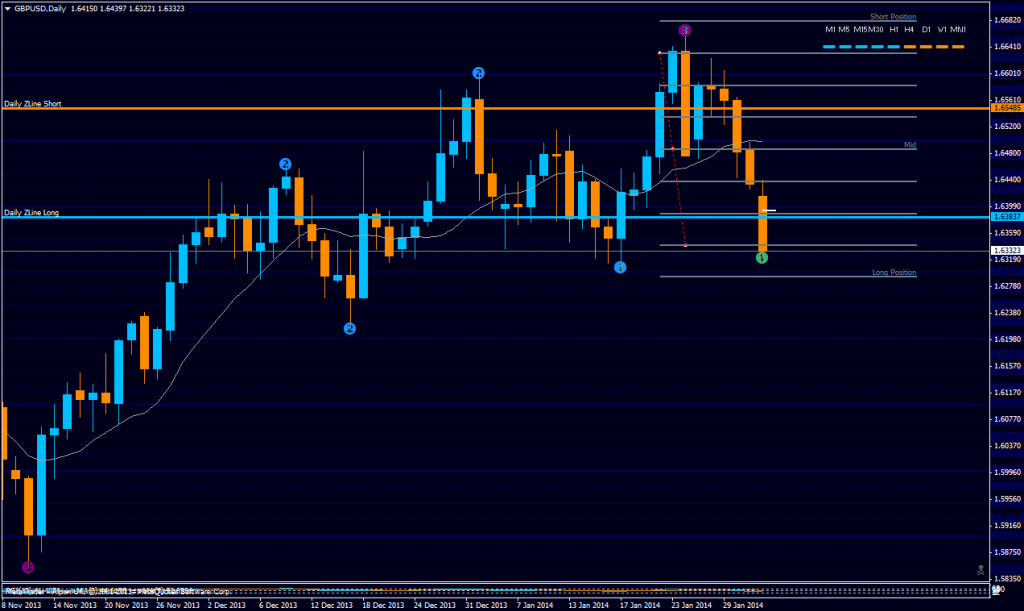
The way I see it is this - if you're looking at the monthly chart the high and low extremes (of all time) show the greatest potential. If the currencies are at parity, the least. If price is in the bottom quarter, your bias is long and vice versa.
Now drop to smaller charts and do the same with the higher bias in mind.
 But the largest chart you're looking at is where you're trying to position from so to most of us, the monthly is rather too large.
But if you put in in the context of the daily chart, find the range between momo from the low and momo from the high. Note where price is now - if it's near the high then you're looking for shorts as you'll be positioning from the high of the daily swing and vice versa. if price is in the middle - too expensive to bother with.
Then for safety, trade in the direction of the most recent daily momo from a swing high or low - i.e. GU the most recent was the large daily down bar, so trade from the high in that direction until it reaches the low. If it goes through the low, you then need a re-think....at that point it's certainly too expensive to short from the area you were shorting from before but there may be a nearer one but you have to then be aware of lower price levels where price ay react etc.
Now drop to smaller charts and do the same with the higher bias in mind.
But if you put in in the context of the daily chart, find the range between momo from the low and momo from the high. Note where price is now - if it's near the high then you're looking for shorts as you'll be positioning from the high of the daily swing and vice versa. if price is in the middle - too expensive to bother with.
Then for safety, trade in the direction of the most recent daily momo from a swing high or low - i.e. GU the most recent was the large daily down bar, so trade from the high in that direction until it reaches the low. If it goes through the low, you then need a re-think....at that point it's certainly too expensive to short from the area you were shorting from before but there may be a nearer one but you have to then be aware of lower price levels where price ay react etc.
-
newscalper
- rank: 1000+ posts
- Posts: 1068
- Joined: Tue Oct 19, 2010 5:58 pm
- Reputation: 7
- Gender:
It's really just the same old s/d stuff as ever but helps join up the timeframes, Seiden isn't clear on that at all.
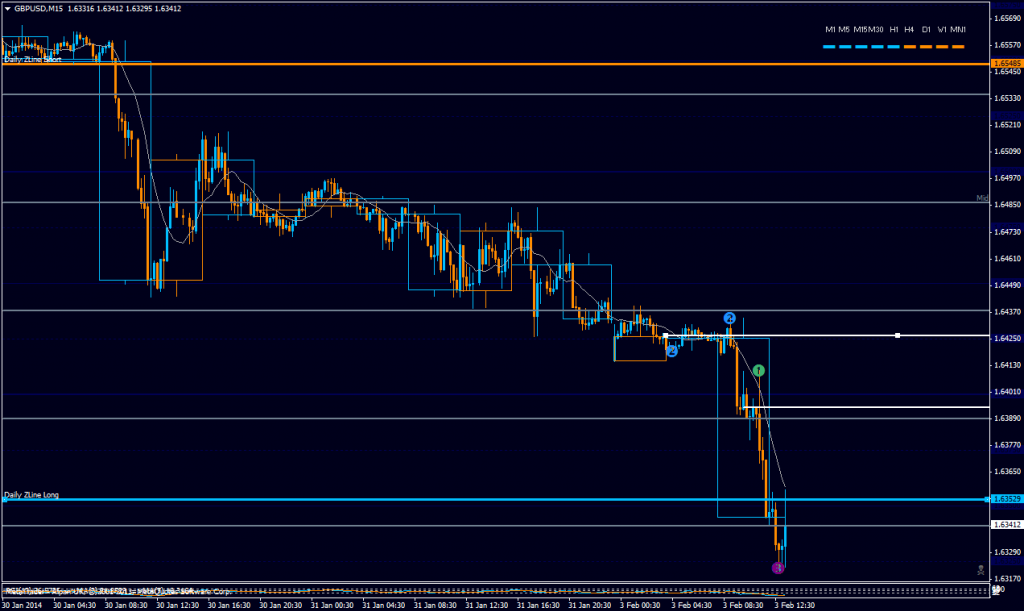
So atm, it's cheap enough to buy but as I would be going against the current flow I need some fresh momo in my favour first - something apparent on H4 I reckon, the white lines are areas to be aware of.
Of course I could start taking longs right now and scalping a few pips to add into 'space' - position to be below the low shown on the daily chart. But I prefer to have some momo on my side first I think: sitting on my hands for now.
-
newscalper
- rank: 1000+ posts
- Posts: 1068
- Joined: Tue Oct 19, 2010 5:58 pm
- Reputation: 7
- Gender:
Please add www.kreslik.com to your ad blocker white list.
Thank you for your support.
Thank you for your support.