A fresh start! Doji's Trading Journal
Moderator: moderators
-
newscalper

- rank: 1000+ posts

- Posts: 1068
- Joined: Tue Oct 19, 2010 5:58 pm
- Reputation: 7
- Gender:

Please add www.kreslik.com to your ad blocker white list.
Thank you for your support.
Thank you for your support.
-
newscalper
- rank: 1000+ posts
- Posts: 1068
- Joined: Tue Oct 19, 2010 5:58 pm
- Reputation: 7
- Gender:
-
newscalper
- rank: 1000+ posts
- Posts: 1068
- Joined: Tue Oct 19, 2010 5:58 pm
- Reputation: 7
- Gender:
-
newscalper
- rank: 1000+ posts
- Posts: 1068
- Joined: Tue Oct 19, 2010 5:58 pm
- Reputation: 7
- Gender:
OMG LOL.
Could it be that overnight my puny brain has fathomed
Position
Lotsize
Expansion
There's a diagram from MO from way back in the MBT Micro thread when he says it's how he traded for the first few years and confirms my thoughts and what TRO has always said re that there isn't a trend.
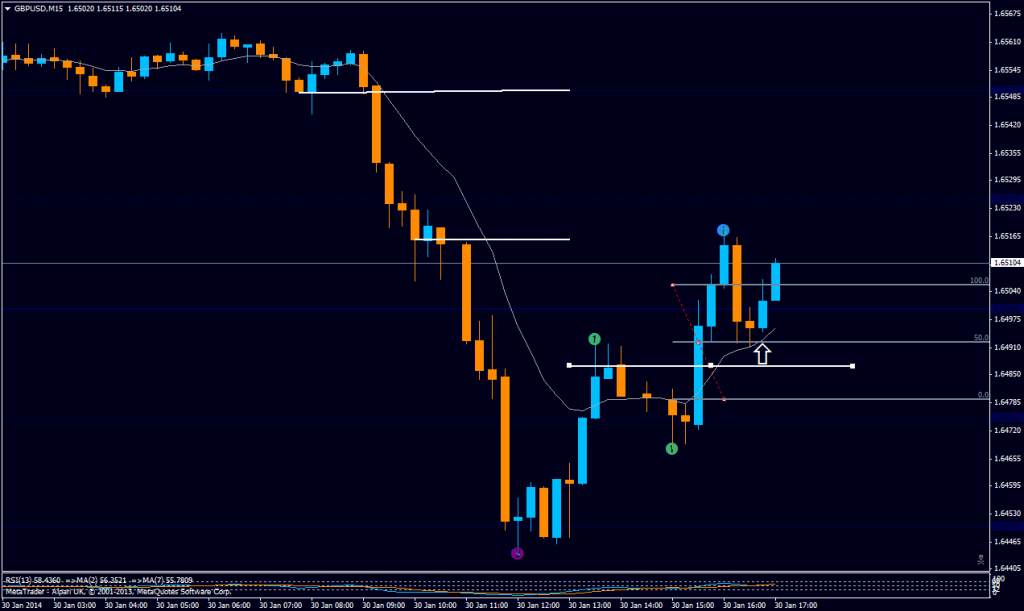
What MOs diagram does is basically define that it doesn't matter if you choose to go long or short, you just define where your position is from (say the high low lines I've marked in the charts above in orange and blue, not the entry lines) and then split the chart between the two lines and define when price is expensive enough to sell and cheap enough to buy.
Using that you CAN literally just use TROs 'Price hits a line' method to enter. I still feel you need a proper defined method for getting out of trades though but anything will do really, even a trailing line based on highs of time-x bars would suffice.
Let me find the diagram. It'll blow yer mind
Could it be that overnight my puny brain has fathomed
Position
Lotsize
Expansion
There's a diagram from MO from way back in the MBT Micro thread when he says it's how he traded for the first few years and confirms my thoughts and what TRO has always said re that there isn't a trend.
What MOs diagram does is basically define that it doesn't matter if you choose to go long or short, you just define where your position is from (say the high low lines I've marked in the charts above in orange and blue, not the entry lines) and then split the chart between the two lines and define when price is expensive enough to sell and cheap enough to buy.
Using that you CAN literally just use TROs 'Price hits a line' method to enter. I still feel you need a proper defined method for getting out of trades though but anything will do really, even a trailing line based on highs of time-x bars would suffice.
Let me find the diagram. It'll blow yer mind
-
newscalper
- rank: 1000+ posts
- Posts: 1068
- Joined: Tue Oct 19, 2010 5:58 pm
- Reputation: 7
- Gender:
Still holding my GU and EJ trades BTW 
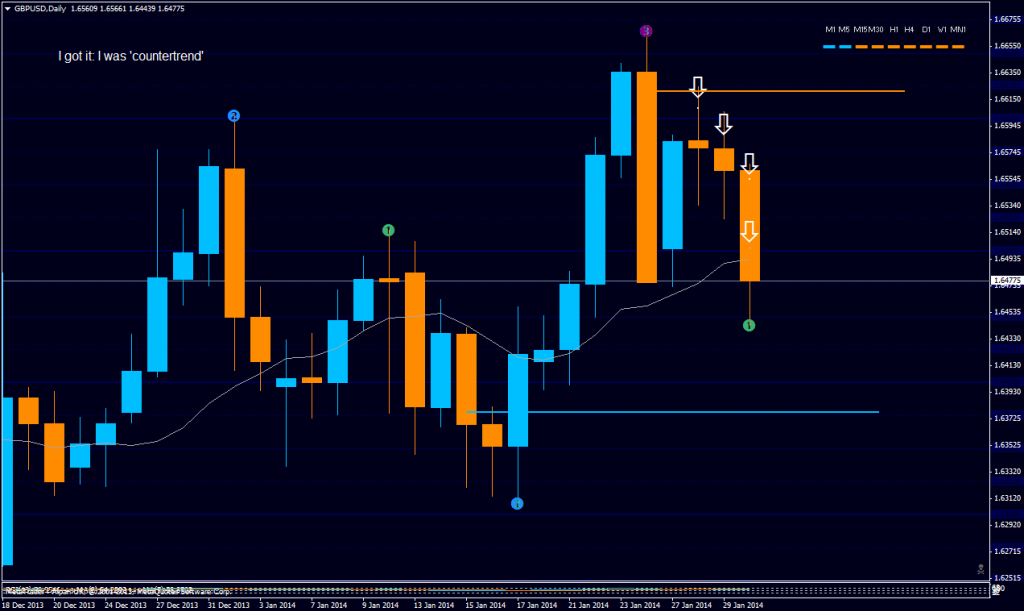
Right, this is MOs picture I think - what it says is, what I've been saying thinking for years and I see we're in agreement, and that is price is ALWAYS moving between two levels - here MO has defined it on the monthly chart but hey
When price is in the red or green areas it's OK to trade, OFF the far extremes. When it's in the grey areas it's OK but not so great.
When it's in the white area it's too expensive.
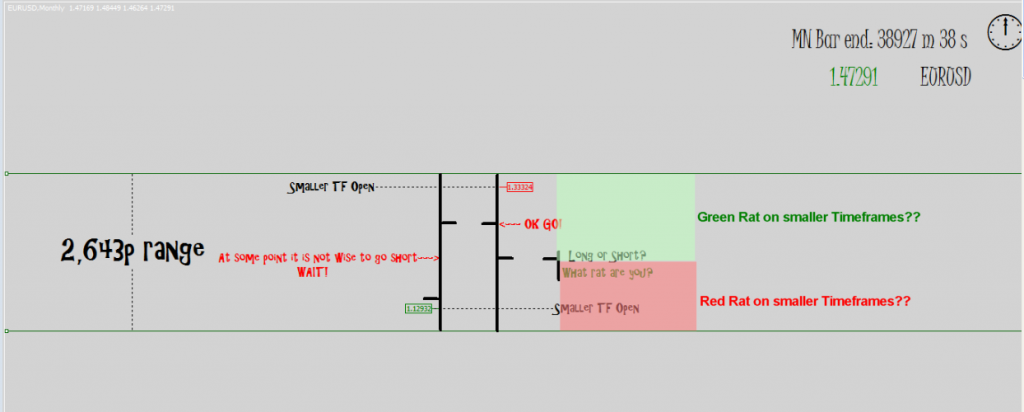
Position, lotsize, yada yada
Right, this is MOs picture I think - what it says is, what I've been saying thinking for years
When price is in the red or green areas it's OK to trade, OFF the far extremes. When it's in the grey areas it's OK but not so great.
When it's in the white area it's too expensive.
Position, lotsize, yada yada
Last edited by newscalper on Fri Jan 31, 2014 10:30 am, edited 1 time in total.
Please add www.kreslik.com to your ad blocker white list.
Thank you for your support.
Thank you for your support.
-
newscalper
- rank: 1000+ posts
- Posts: 1068
- Joined: Tue Oct 19, 2010 5:58 pm
- Reputation: 7
- Gender:

In context

So in context - at the moment, even though both my open trades are working out, my GU one at least was opened in an area where, from the line I'm using to give me direction and context (price is moving down from the high), price was too expensive for me to trade. So I shouldn't be patting myself on the back too much


-
newscalper
- rank: 1000+ posts
- Posts: 1068
- Joined: Tue Oct 19, 2010 5:58 pm
- Reputation: 7
- Gender:
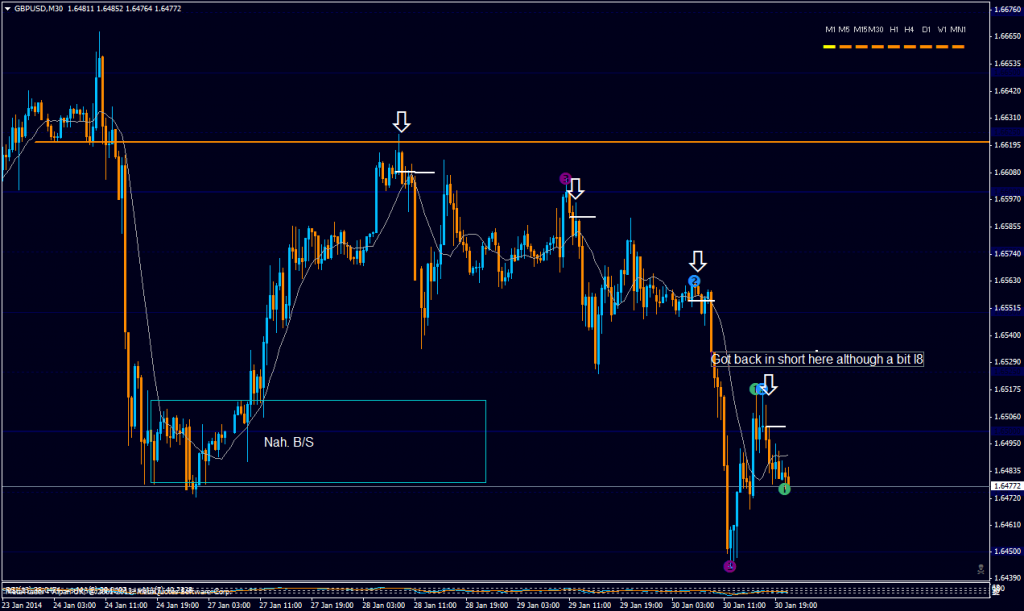
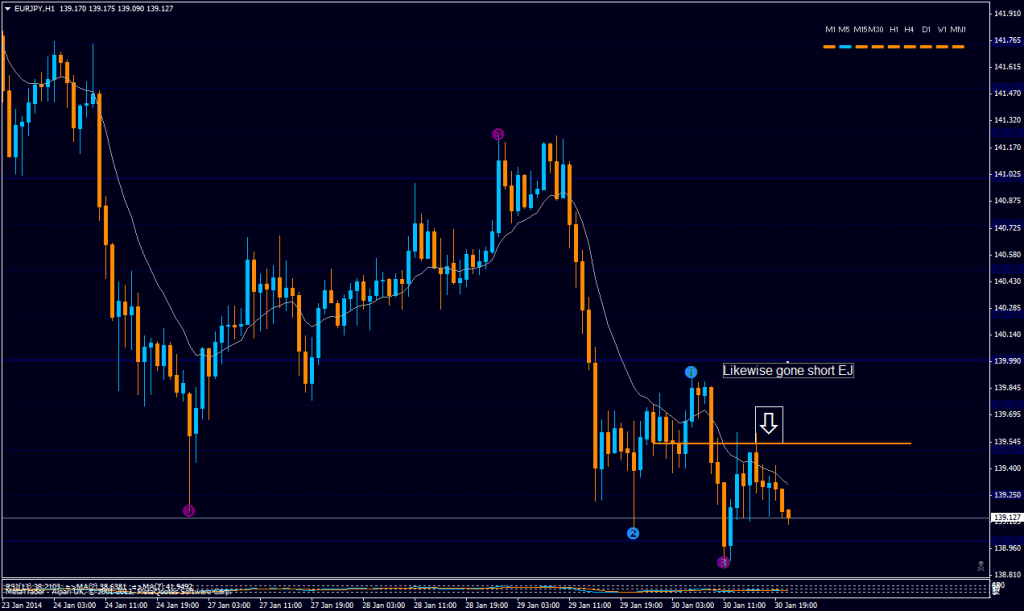
See my EJ trade. If it breaks the range and you're already short you're quids in - the range is just a pricing mechanism not an entry mechanism. It just give a heads up as to areas to position from and profit potential. EJ is trending down like a MOFO - current momentum is down and you stay with the current momentum until it is exhausted. If you want to re-define where the high line is, come next week you can. Find where the new daily zline is (H4 breakout) and work your position from there), there's not too much in its way unless you go up to the weekly chart for quite an old level. New momo has to come into the market (unusually large daily up bar perchance) to think about going long atm.
Still holding EJ and GU short
Still holding EJ and GU short
Please add www.kreslik.com to your ad blocker white list.
Thank you for your support.
Thank you for your support.