Yea Supply/Demand and fibs on extreme marked by semaphors. But the Price action based on principle "Price hits a higher time frame Zline then look for a lower timeframe zline (i.e. you entry chart) away.". <--Dragon Quote by the way.
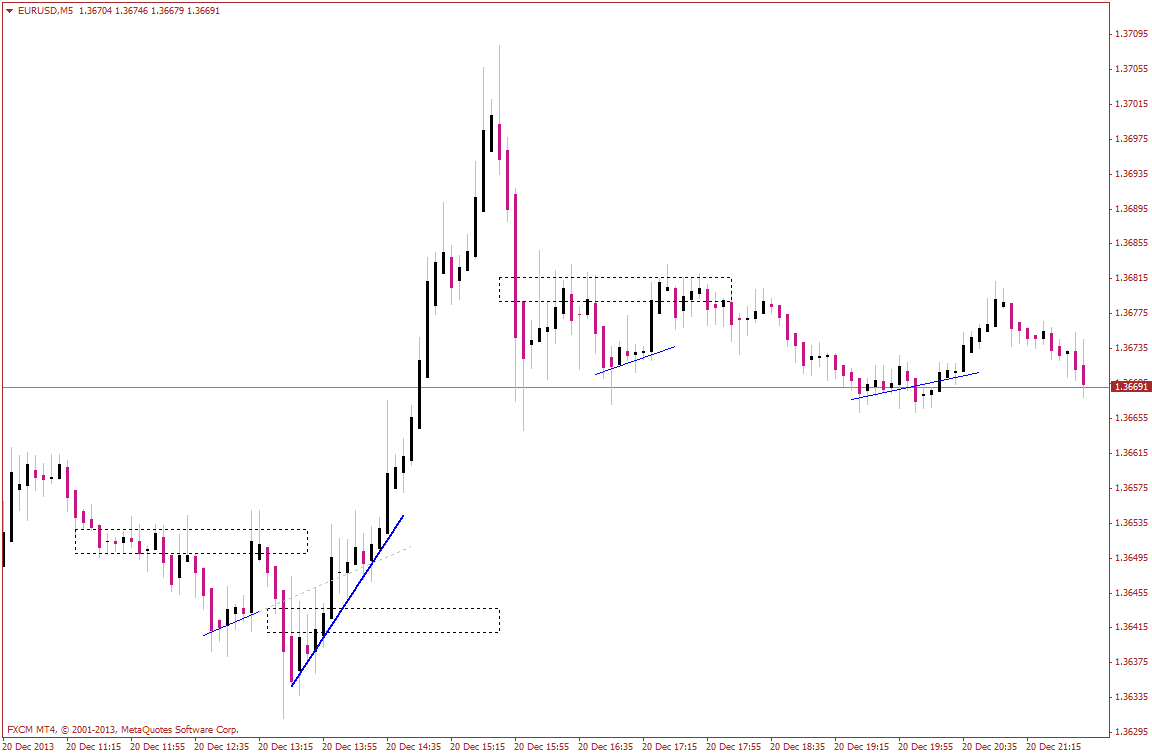
I did some pictures that relate to my previous post to show you what i mean.The pictures below show what i was looking for after price hit the higher timeframe zline. The key is price hit something on Higher time frame first then lower time frame. Making connection between zlines and engulfing patterns made it alot easrier for me see them, i don't know why. Merry Xmas News.
Hope these help. Always following the higher timeframe flow and know when your trading with the flow and counter to the flow and base expectations off that.Remember for example in strong downward movement price will not get back to supply most of the time. Big bars in breakout move help
newscalper wrote:Just closed at 8370
Interesting chart BB - pure S/D? Draw fibs from the candle where the rat is @ the sema on the hourly - the ensuing PA has to break out of a pointy, then look for an entry on return. Entry candle has to close over a line whether that's of a single candle or of a run of candles. I think that's it anyway.
Merry Christmas everyone and thanks: Doji, BB, TRO, MO and all.