Postby dojirock » Sat Nov 09, 2013 6:26 am
Kind of Arkan.
If your looking for a set of defined rules then yes, your 100 percent right.
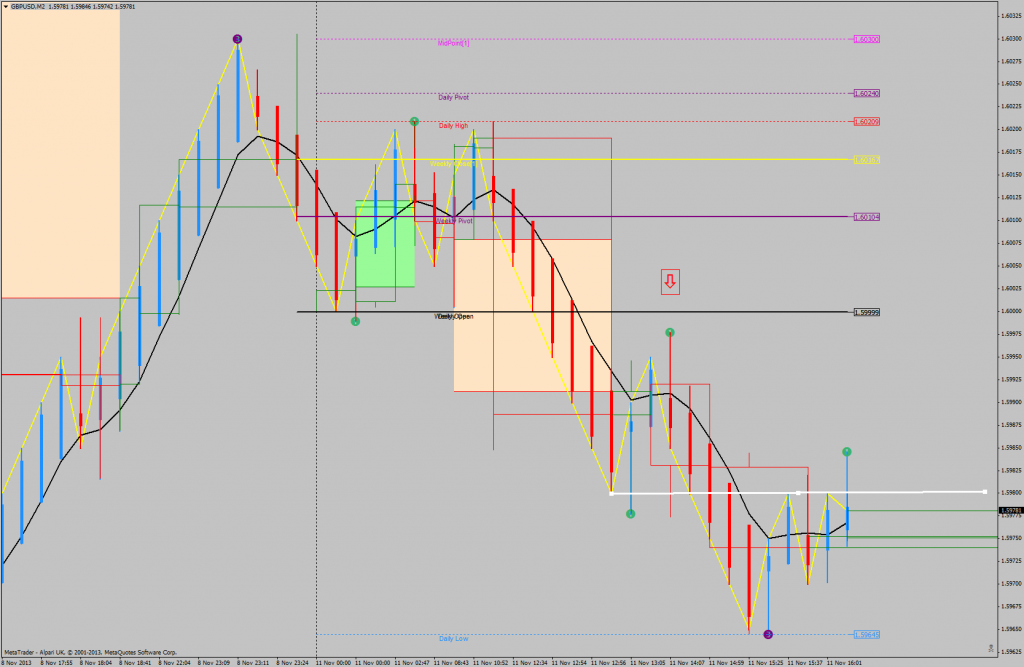
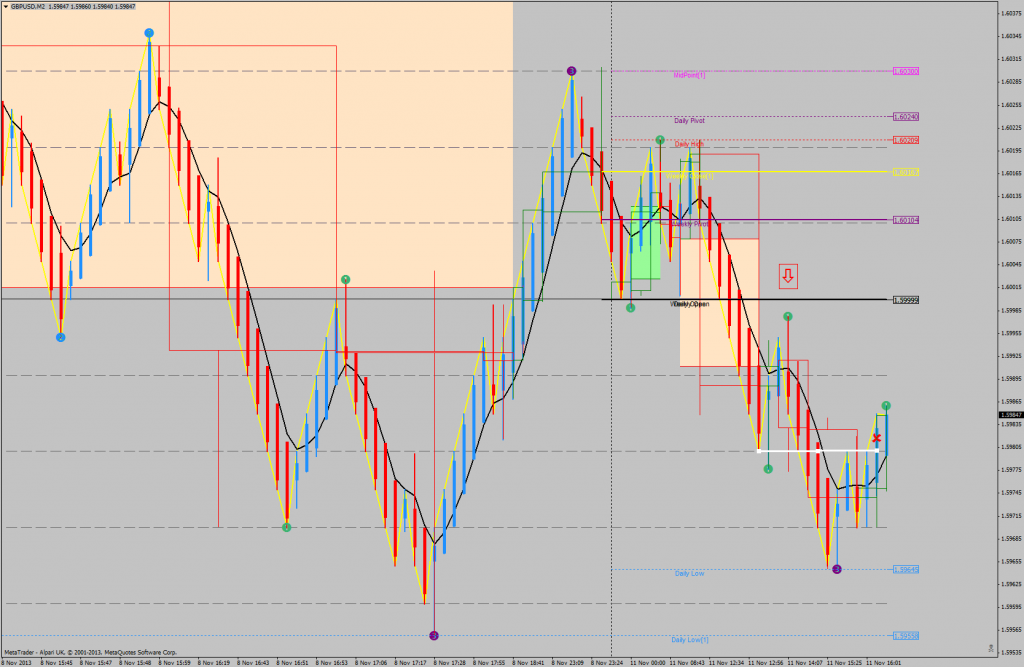
The market cant be mastered that way though. I use it as a strong indication of how I see the market and it tells me a direction to trade in. BUT I do still look at momentum, break of momentum ect. For example in the above picture, by the definable rules, yes the "should have entered here" is spot on. I would also go short at the top line of your red RB also due to the fact we had a bullish RB that failed to break with the next red RB, price starts to shoot away long but then look what happens? we get a close below the bullish RB twice and the candle at top before that close was a bearish momentum candle... I guess my point is, with everything I have learned, I have never traded just by the definable rules of RB alone but I can tell you and you will see for yourself, a very high percentage of turns in the market, the RB's are spot on when used correctly. Over time I have learned to enter at closes of a failed RB and add to my position as stacks when the RB's give me confluence.
Hope this makes sense...
It always takes Momentum to break Momentum!
"A small loss is just as satisfying as a large gain" -MO
"Sometimes we need to stop learning and start thinking...."
"Once you stack, you'll never go back!"