At a minimum, your stop should rest on the extreme of the last 24 hours.
You should only (momentarily) place your stop within the daily range for 2 reasons:
a) you are trading minimum size (3-5 units) with a 10-15 pip stop; not to consume more than 1/3-1/2 of your total risk space.
b) you increased your size and need to normalize risk.
c) you have nunchuck skills =)
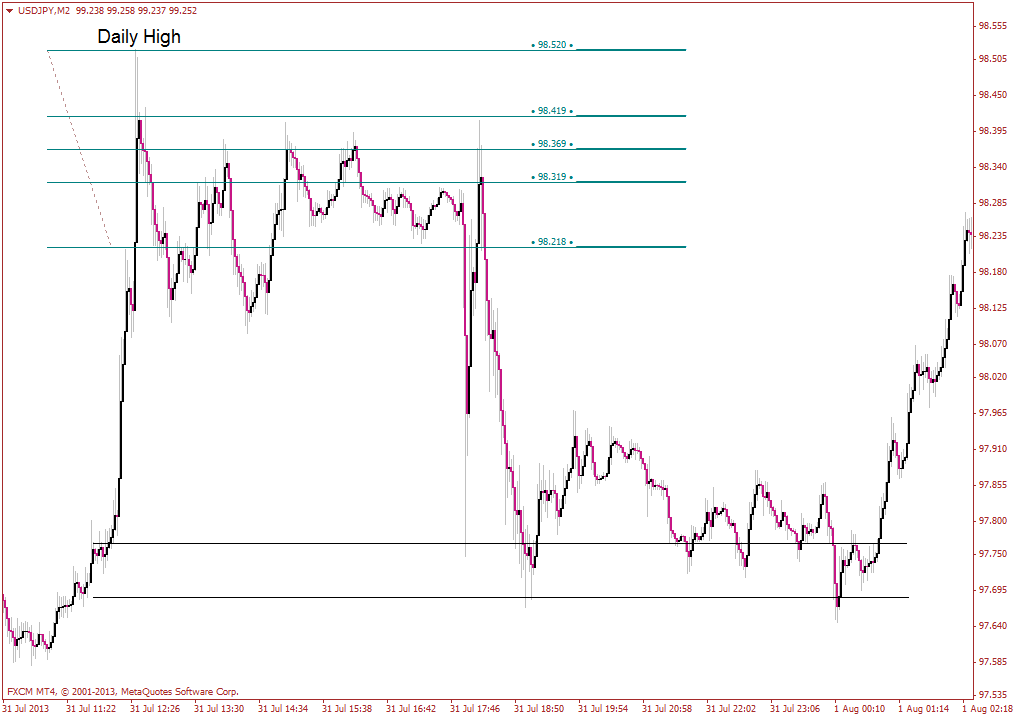
I start with position on a long term extreme and trade from 2 minute charts (& yes, I delay my own data by 3 seconds).
From there I might have a ZL setup:
or the strong rally may have brought me to within range of an even higher extreme on a multiday chart...
just start by trading the small chart with a longer term extreme.
If you have a long term extreme then you can turn your short term trades into anything, but if you only have short term extremes then you leave yourself with few options.