Postby dojirock » Tue Jun 04, 2013 1:16 am
No problem Karma,
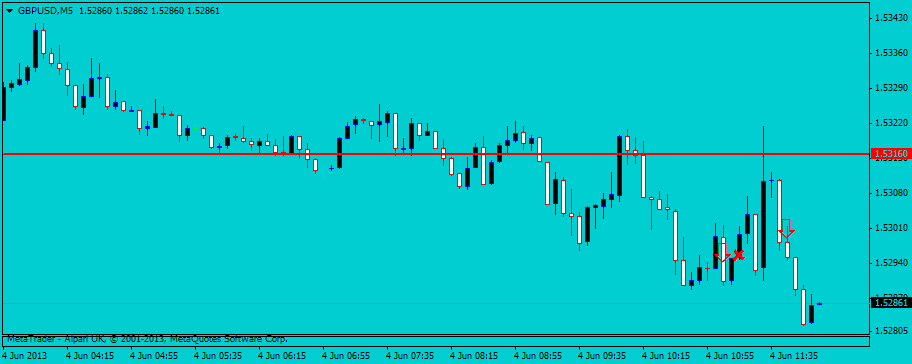
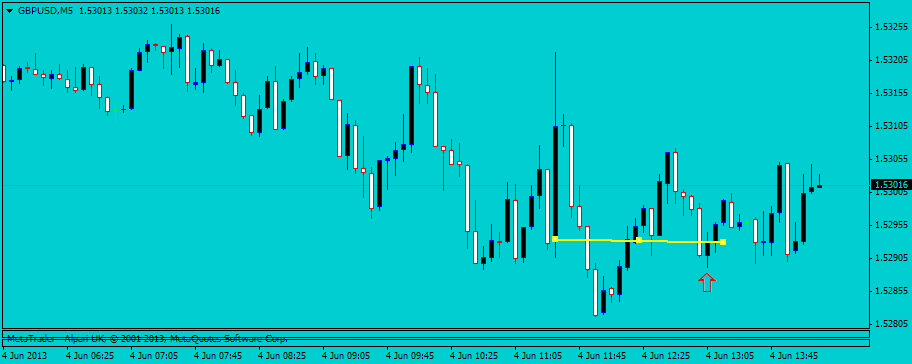
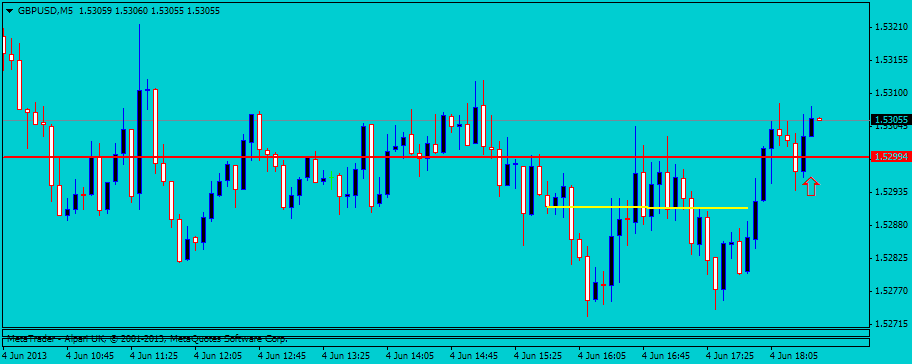
My thread has been about my journey learning to read price action and zlines. I feel I have excelled in that form of trading. Being completely honest, not everyone will be able to see price action in this way so my thread has transformed slightly to various ways to use indicators to see price action. The underlying action is still there to those that can see it. The indicators point out the valid areas by using simple criteria. The number one question I get asked is how I determine my bias? I use price action. I use indicators to help traders determine a direction and with a little understanding of price action and zlines, clobber the market by taking pips! The template im using currently is one simular to DCHappy's. The arrows and text that reads "hop" is just where a macd line "hops" over the zeroline, or as pro would say the waterline. These are necessarily entries. That being said I will explain how I tie zline price action to those in the next pic.
It always takes Momentum to break Momentum!
"A small loss is just as satisfying as a large gain" -MO
"Sometimes we need to stop learning and start thinking...."
"Once you stack, you'll never go back!"