trueblueTEX wrote:seacap wrote:Ok Doji, your explanation is clear. One question though. Your top line was tested and you went long. But soon after price closed below that line. Does it change our bias to short or we do not look at this line after it was tested once?dojirock wrote:Once my zlines are drawn. I stated I move up one time frame. It takes momentum to break a zline. I want to see 1hour or higher momentum break these lines before going short.
The 1st, bottom zline has had no return yet...so we skip it.
The next zline has on this hourly chart an attempt to retest it with a result of failing to do so. A down candle, a up candle. Since this line failed...I go long. Keep it simple.
The next zline has an attempt also, it gets wicked then a up candle. Another fail, I go long. Keep it simple.
The vertical lines are just to show points of reference from when the zlines were drawn so we can see that when we switch time charts.
Did you notice looking at the 30 min chart price did close below the line? It fools you. We want to see a stronger momentum. Thats why I personally move up a time frame.
Still with me....
??
Seacap,
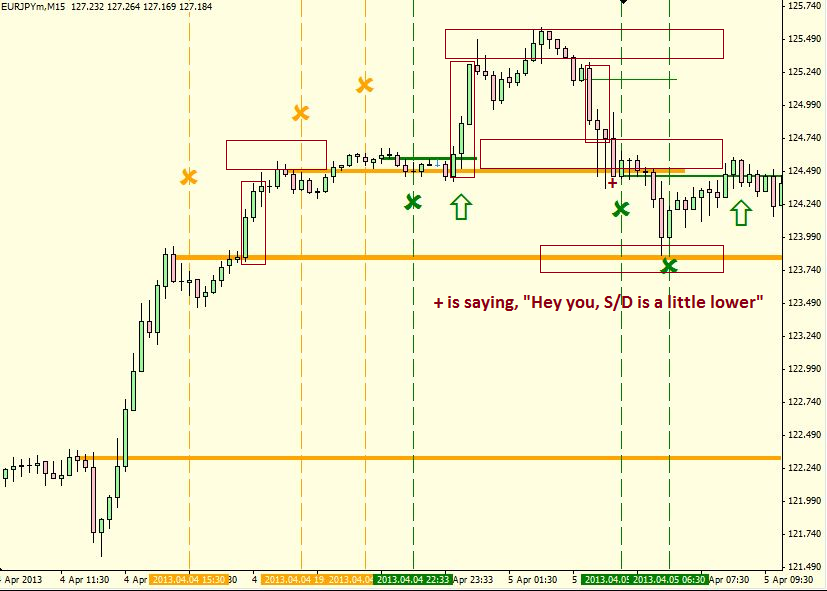
If I'm reading this correctly, while the last (top) long zline was broken, there was a new m15 short zline created (upper right) before the H1 break of the most recent long zline. And immediately after the close under, a new m15 short zline is created again and it fails before doji's second long arrow.
Of course, I suppose you could have shorted at the close under and go down to the next zline (which is indeed where price went) and then turn around and go long like doji did at the second up arrow.
Comments on my chart markup??
I'm not 100% certain I've used the correct terminology in my comments above (I didn't use words like "fail" for example.) edit: whoops, yes I did say "fail" just not sure if I used it correctly!!
THIS IS TRUEBLUETEX's chart that I marked by hand.